Four questions decide almost every test an Indian thesis needs. What kind of variables do you have? How many groups or measurements are you comparing? Are the observations related or independent? And does the data meet the assumptions? Answer those in order and the table below gives you the test. Our comparison of statistical tools for an Indian thesis deliberately leaves this question open on the principle that you decide the analysis before the tool; this article is that decision.
| What you want to know | Outcome variable | Design | Parametric test | Non-parametric equivalent |
|---|---|---|---|---|
| Do two independent groups differ? | Continuous | 2 separate groups | Independent-samples t-test | Mann-Whitney U |
| Did the same people change? | Continuous | 2 measurements, same people | Paired-samples t-test | Wilcoxon signed-rank |
| Do three or more groups differ? | Continuous | 3+ separate groups | One-way ANOVA | Kruskal-Wallis H |
| Did the same people change across 3+ points? | Continuous | 3+ measurements, same people | Repeated-measures ANOVA | Friedman test |
| Do two factors interact? | Continuous | 2 grouping variables | Two-way ANOVA | Aligned rank transform, or model-based alternatives |
| Do two continuous variables move together? | Continuous | Paired observations | Pearson correlation | Spearman rho |
| Do several variables predict an outcome? | Continuous | Predictors of any type | Multiple linear regression | Robust regression or bootstrapped estimates |
| Do several variables predict a yes/no outcome? | Binary | Predictors of any type | Binary logistic regression | Not applicable — logistic is already suited |
| Are two categorical variables associated? | Categorical | Cross-tabulation | Chi-square test of independence | Fisher’s exact test for small expected counts |
| Do observed frequencies match expectation? | Categorical | One variable | Chi-square goodness of fit | Exact multinomial alternatives |
| Do groups differ after adjusting for a covariate? | Continuous | Groups plus covariate | ANCOVA | Rank-based ANCOVA alternatives |
| Does a latent-variable model fit? | Continuous indicators | Measurement plus structural model | Structural equation modelling | Partial least squares SEM for small samples |
Question 1: What kind of variable is your outcome?
This single distinction eliminates most of the table. If your outcome is continuous — a score, an amount, a duration, a mean of Likert items treated as a scale — you are in t-test, ANOVA, correlation and regression territory. If it is categorical — yes/no, adopted/not adopted, three preference categories — you are in chi-square and logistic regression territory.

The recurring judgement call in survey-based theses is the Likert item. A single Likert item is ordinal, and the conservative treatment is non-parametric. A summated scale built from several Likert items measuring one construct is conventionally treated as continuous in most applied fields, and that treatment is widely accepted — provided the scale is genuinely unidimensional and you report its reliability, which is exactly the argument set out in our guide to an acceptable Cronbach’s alpha for a thesis. State which treatment you adopted and why; do not leave it implicit.
Question 2: How many groups or measurements?
Two groups take a t-test. Three or more take an ANOVA. This is where the most consequential shortcut in student analysis happens: running three separate t-tests to compare three groups instead of one ANOVA.
Do not do it. Each test carries its own chance of a false positive, and running several on the same data inflates the overall error rate — which is precisely the problem ANOVA exists to solve. Run the ANOVA first; if it is significant, then run post-hoc comparisons with an appropriate correction to find out which pairs differ. Reporting “we ran t-tests between each pair” is a line examiners recognise instantly.
Question 3: Are the observations related or independent?
Independent means different people in each group: permanent staff versus contractual staff, urban versus rural respondents. Related means the same people measured more than once, or deliberately matched pairs: pre-test and post-test, before and after an intervention, the same participants rating three products.
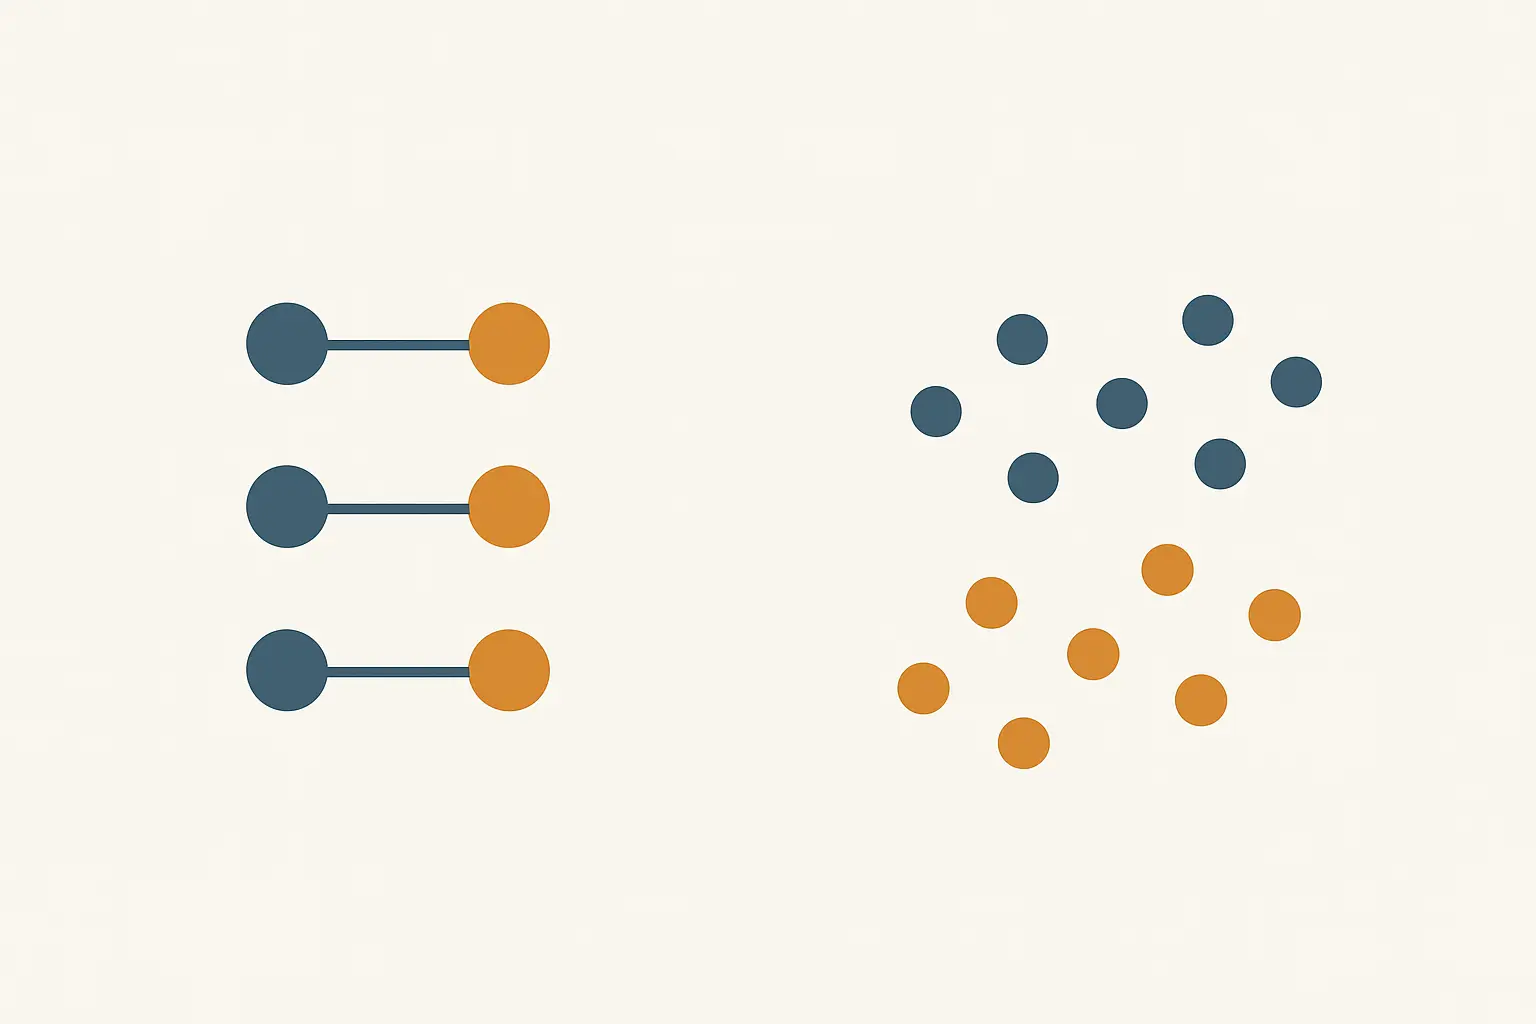
Getting this wrong is costly in both directions. Using an independent-samples test on paired data discards the pairing, which is usually the most informative feature of the design, and typically loses power. Using a paired test on independent groups is simply invalid. If your design has a pre and a post on the same participants, the test has “paired” or “repeated measures” in its name.
Question 4: Does the data meet the assumptions?
Each parametric test carries assumptions, and the right-hand column of the table exists because those assumptions sometimes fail. The three that matter most in practice:
- Normality. Strictly, the assumption concerns the distribution of the outcome within groups, or of the residuals in a regression — not the raw dataset as a whole. Assessed with the Shapiro-Wilk or Kolmogorov-Smirnov test, skewness and kurtosis, and visual methods.
- Homogeneity of variance. Group variances should be comparable, tested with Levene’s test. Where it fails for a two-group comparison, the Welch correction is a standard and well-accepted remedy that most packages offer alongside the ordinary t-test.
- Independence of observations. The one that cannot be fixed after the fact. If your respondents are clustered — students within classrooms, employees within branches — an ordinary regression treats them as independent when they are not, and the remedy is a multilevel model, not a correction.
Two further checks belong to regression specifically: multicollinearity among predictors, assessed with variance inflation factors, and the assumption of linear relationships between predictors and outcome.
Sample size sits inside this decision, not beside it
The test you choose determines the sample size you need, which is why the two decisions have to be made together and made early. A design requiring a multiple regression with six predictors needs a different N from a two-group comparison, and the calculation differs by test family — the routes are compared in our guide to calculating sample size for a thesis. Choosing the test after the data has been collected is how scholars discover, too late, that the design they wanted was never adequately powered.
Four mistakes that cost marks
- Running every test and reporting the significant ones. This is p-hacking whether or not you intend it, and the tell is a results chapter with more tests than hypotheses. Decide your analyses when you write your objectives, and report what you planned.
- Treating a significant result as a large one. With a big sample, trivial differences become significant. Report the effect size beside every p-value so the reader can judge magnitude, using the templates in our guide to writing the results chapter.
- Reading correlation as causation. A significant regression coefficient in cross-sectional survey data supports an association, not an effect. Your discussion chapter should say “associated with”, and your limitations section should say why.
- Switching to a non-parametric test without saying why. If you ran Mann-Whitney instead of a t-test, report the assumption check that led you there. A silent substitution reads like a search for a better p-value.
What if your design is qualitative or mixed?
None of this applies to interview or case-study data, which has its own quality criteria — adequacy of sampling, saturation, and coding transparency, discussed in how many interviews are enough for a qualitative thesis. In a mixed-methods design, choose the quantitative test using this table and argue the qualitative strand separately; a common and avoidable error is a methodology chapter that justifies one strand thoroughly and the other in a sentence.
Deciding the analysis, then writing it up
The analysis plan belongs in your methodology chapter, written before you touch the data: which test for which hypothesis, which assumption checks, and what you will do if an assumption fails. A committee that sees that plan asks fewer questions, and an examiner who sees it knows the results were not shopped for.
Tesify keeps your chapters structured and your citations attached to real sources as you draft, so the analysis plan you wrote in Chapter 3 is still the analysis you report in Chapter 4. Every statistical judgement remains yours.
Start writing your methodology chapter in Tesify
Frequently asked questions
How do I know which statistical test to use?
Answer four questions in order: what type is your outcome variable, how many groups or measurements, are observations related or independent, and are the assumptions met. Those four answers point to a single row in the decision table.
T-test or ANOVA?
T-test for two groups, ANOVA for three or more. Never substitute multiple t-tests for one ANOVA, because repeated testing on the same data inflates the false-positive rate.
Can I treat Likert data as continuous?
A summated multi-item scale is conventionally treated as continuous in most applied fields; a single item is ordinal and is more safely handled non-parametrically. State and justify whichever treatment you adopt.
What is the non-parametric equivalent of a t-test?
Mann-Whitney U for independent samples and Wilcoxon signed-rank for paired samples. For ANOVA the equivalents are Kruskal-Wallis and Friedman respectively.
When should I use chi-square?
When both variables are categorical and you are testing association in a cross-tabulation. Where expected cell counts are very small, Fisher’s exact test is the appropriate alternative.
Correlation or regression?
Correlation describes the strength and direction of a relationship between two variables. Regression predicts an outcome from one or more predictors and lets you estimate each predictor’s unique contribution.
Do I need to test assumptions before every test?
Yes, and you need to report the check. The assumption checks are part of the results chapter, and a test chosen without a visible check invites the question of why that test.
What test do I use for a pre-post design with a control group?
A mixed ANOVA with time as the within-subjects factor and group as the between-subjects factor, or ANCOVA with the pre-test score as a covariate. Both are defensible; choose one and justify it.
Is SEM appropriate for a Master’s dissertation?
It can be, but it demands a well-specified measurement model and an adequate sample. Where the sample is modest, partial least squares SEM is the more commonly used route, with its own reporting expectations.
What if my data violates several assumptions at once?
Consider a non-parametric equivalent, a transformation, or a robust or bootstrapped procedure, and report the reasoning. Multiple violations are usually a signal about the data-collection design worth discussing in your limitations.
Should the analysis plan be in the proposal?
Yes. Naming the test for each hypothesis at the proposal stage is the single most effective way to prevent an underpowered design and a results chapter that looks improvised.
Does the choice of software change which test I should run?
No. The design determines the test; the software only determines how you run it and how the output is labelled. Decide the analysis first, then open the package.