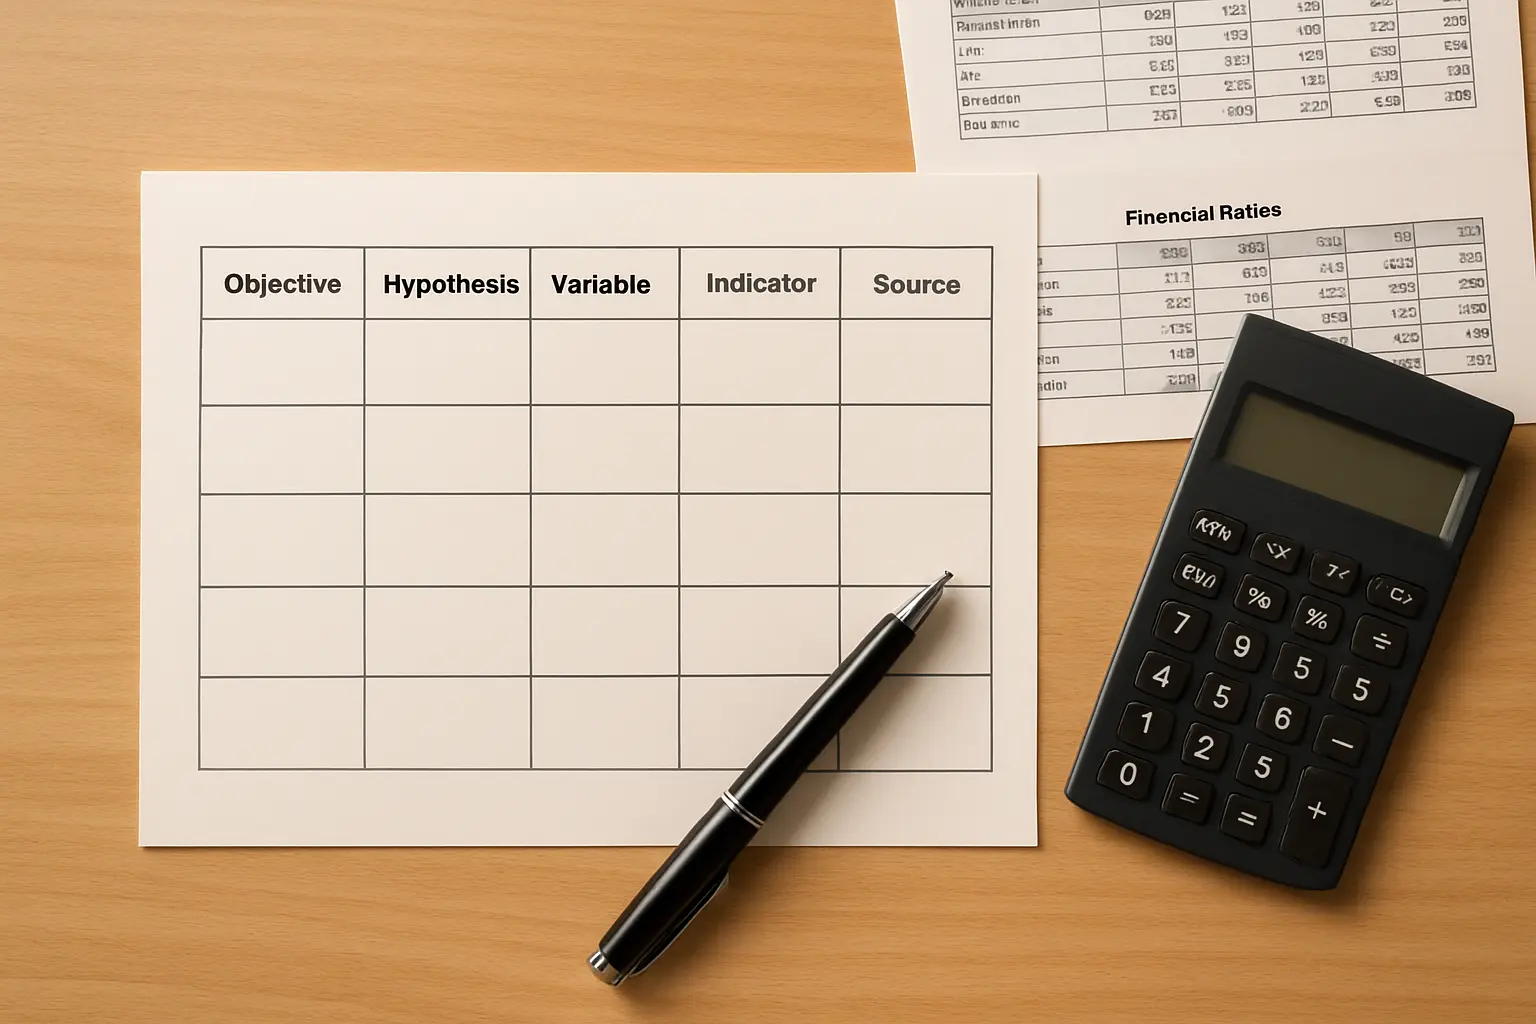
A consistency matrix is the one page a guide reads before any chapter, because it is the page that proves your accounting or finance dissertation is buildable at all. It lays every objective next to the hypothesis it tests, the variable that hypothesis names, the indicator that measures the variable, the data source that supplies it, and the statistical tool that analyses it — in one row, so a mismatch is visible before you have written a word of Chapter 3.
Most Indian commerce and management departments ask for this table under a different name in the ordinance — sometimes “framework of the study”, sometimes folded into the synopsis’s methodology section — but the content examiners actually check is the same six-column alignment. This guide builds it from scratch for three worked accounting and finance topics, then gives you the five-step method to build your own.
The six columns, and what each one has to survive
| Column | What it states | What kills it |
|---|---|---|
| Objective | One verb, one relationship, one population | Two relationships stitched into one objective |
| Hypothesis | The testable form of the objective, usually the null | A hypothesis that names a relationship the objective never mentioned |
| Variable(s) | Independent, dependent, and any moderating or control variable, each labelled | A variable named without saying which role it plays |
| Indicator | The exact ratio, score or figure that operationalises the variable | A variable with no stated formula or scale behind it |
| Data source | Where the indicator’s number actually comes from, and the period | “Secondary data” with no named source |
| Analysis tool | The specific statistical test the hypothesis needs | A test that cannot answer the hypothesis as worded |
The discipline in that table is what a consistency matrix is for: every column has to trace back to the one before it and forward to the one after it. An indicator with no data source is a promise; a hypothesis with no matching test is a plan that cannot be executed in Chapter 4. The verb-to-design pairing that decides the objective column is covered in our guide to objectives and the design each verb commits you to; this page starts one column further along, once the objective is already written.
Worked example 1: Non-performing assets and bank profitability
A correlational, ratio-based topic common in M.Com and MBA-Finance dissertations on the Indian banking sector.
| Objective | Hypothesis | Variable | Indicator | Data source | Analysis tool |
|---|---|---|---|---|---|
| To examine the relationship between non-performing assets and profitability in [named] scheduled commercial banks over [n] years | H0: There is no significant relationship between the Net NPA ratio and Return on Assets | Independent: Net NPA ratio · Dependent: profitability | Net NPA ratio (Net NPAs ÷ Net Advances × 100); Return on Assets (Net Profit ÷ Total Assets × 100); Return on Equity as a secondary indicator | Audited annual reports and Basel disclosures of the sampled banks, plus the RBI’s Statistical Tables Relating to Banks publication, for the stated financial years | Pearson correlation between Net NPA ratio and ROA; panel regression with bank and year fixed effects if the sample spans multiple banks and years |
Notice what the data-source column is doing: it names the actual filing (audited annual reports, a specific RBI publication) rather than the word “secondary data”, and it commits to a stated set of years before the analysis starts. An examiner’s first question on this row is almost always whether Net NPA or Gross NPA was used and why — state the choice and the reason in the same cell rather than leaving it to the methodology chapter to explain alone.

Worked example 2: Working capital management and firm profitability
A common topic for a listed-company or sector-based finance dissertation, with more than one independent variable.
| Objective | Hypothesis | Variable | Indicator | Data source | Analysis tool |
|---|---|---|---|---|---|
| To assess the effect of working capital management on the profitability of [named] companies listed on [exchange] over [n] years | H0: Working capital management components have no significant effect on Return on Assets | Independent: Cash Conversion Cycle, Current Ratio, Quick Ratio · Dependent: profitability · Control: firm size, leverage | Cash Conversion Cycle (Days Inventory Outstanding + Days Sales Outstanding − Days Payables Outstanding); Current Ratio; Quick Ratio; ROA; firm size as log of total assets; leverage as Debt-to-Equity | Standalone audited financial statements filed with the Registrar of Companies / stock exchange disclosures for the sampled companies, for the stated financial years | Multiple linear regression of ROA on the working-capital indicators with firm size and leverage as controls; a variance-inflation-factor check for multicollinearity before interpreting coefficients |
This row has four independent-side variables and two controls, which is exactly the point at which students start dropping columns. Keep every control variable in the matrix even though it is not the study’s main interest — an examiner who finds firm size discussed in Chapter 4 but absent from the matrix will ask why it was not planned for. Whether your regression needs a multicollinearity check at all, and how to read one, is in our note on choosing the right statistical test.
Worked example 3: Investor behaviour and disposition effect (survey-based)
A behavioural-finance topic, where the indicator is a scale score rather than a ratio pulled from a filing.
| Objective | Hypothesis | Variable | Indicator | Data source | Analysis tool |
|---|---|---|---|---|---|
| To examine whether the disposition effect differs between novice and experienced retail investors in [named city/region] | H0: There is no significant difference in disposition-effect scores between novice and experienced retail investors | Independent: investor experience (novice / experienced, grouping variable) · Dependent: disposition-effect tendency | Disposition-effect score from a [n]-item structured questionnaire adapted from published behavioural-finance scales, scored on a 5-point Likert scale, with experience classified by years of active trading as self-reported in the demographic section | Primary data collected from a sample of retail investors via a self-administered questionnaire, [month/year] to [month/year] | Independent-samples t-test if the score is roughly normal, or the Mann-Whitney U test if it is not; reliability of the scale reported as Cronbach’s alpha before the group comparison is run |
The indicator column is doing more work here than in the ratio-based rows, because a behavioural construct has no filed number to point to. Say explicitly that the instrument is adapted rather than invented, and state the adaptation. Which validated scale to reach for, and where the permission question sits, is covered for a neighbouring discipline in our guide to validated scales for a psychology dissertation — the same instrument-sourcing discipline applies to a finance questionnaire.
Building your own matrix in five steps
- Write the objectives first, and only the objectives. One verb, one relationship each. Do not touch the hypothesis column until every objective reads as one clean sentence.
- Convert each objective into its null hypothesis. “To examine the relationship between X and Y” becomes “H0: there is no significant relationship between X and Y.” If an objective resists this conversion, it is usually descriptive rather than relational, and does not need a hypothesis at all — state that in the matrix rather than forcing one.
- Name every variable and its role. Independent, dependent, moderating, control. A variable with no role is not yet a variable in the matrix’s sense.
- Pin the indicator to a formula or a scale before you pin it to a source. “Profitability” is not an indicator; “Return on Assets, computed as Net Profit divided by Total Assets” is. Only once the formula is fixed does the data-source column have a real target to name.
- Choose the analysis tool against the hypothesis’s own wording, not against what software you already know. A hypothesis about a difference between two groups needs a test of difference; a hypothesis about a relationship needs a test of association or a regression. Picking the tool first and writing the hypothesis to fit it is visible to an examiner and is the single most common reason this table is sent back.
Five faults that send the matrix back
- An objective with two relationships. “To examine the impact of liquidity and leverage on profitability and to compare public and private banks” is two studies wearing one sentence. Split it before the hypothesis column.
- A hypothesis broader than its objective. The objective names one indicator; the hypothesis suddenly tests three. Keep them locked together.
- An indicator with no formula. “Liquidity” is a variable name, not an indicator. State the ratio.
- A data source that is really a wish. “Company websites” or “secondary sources” without naming which filing, which portal, which years.
- A mismatched analysis tool. Regression run on a hypothesis that only asked whether two group means differ; a t-test run on a hypothesis that asked about a relationship between two continuous variables.
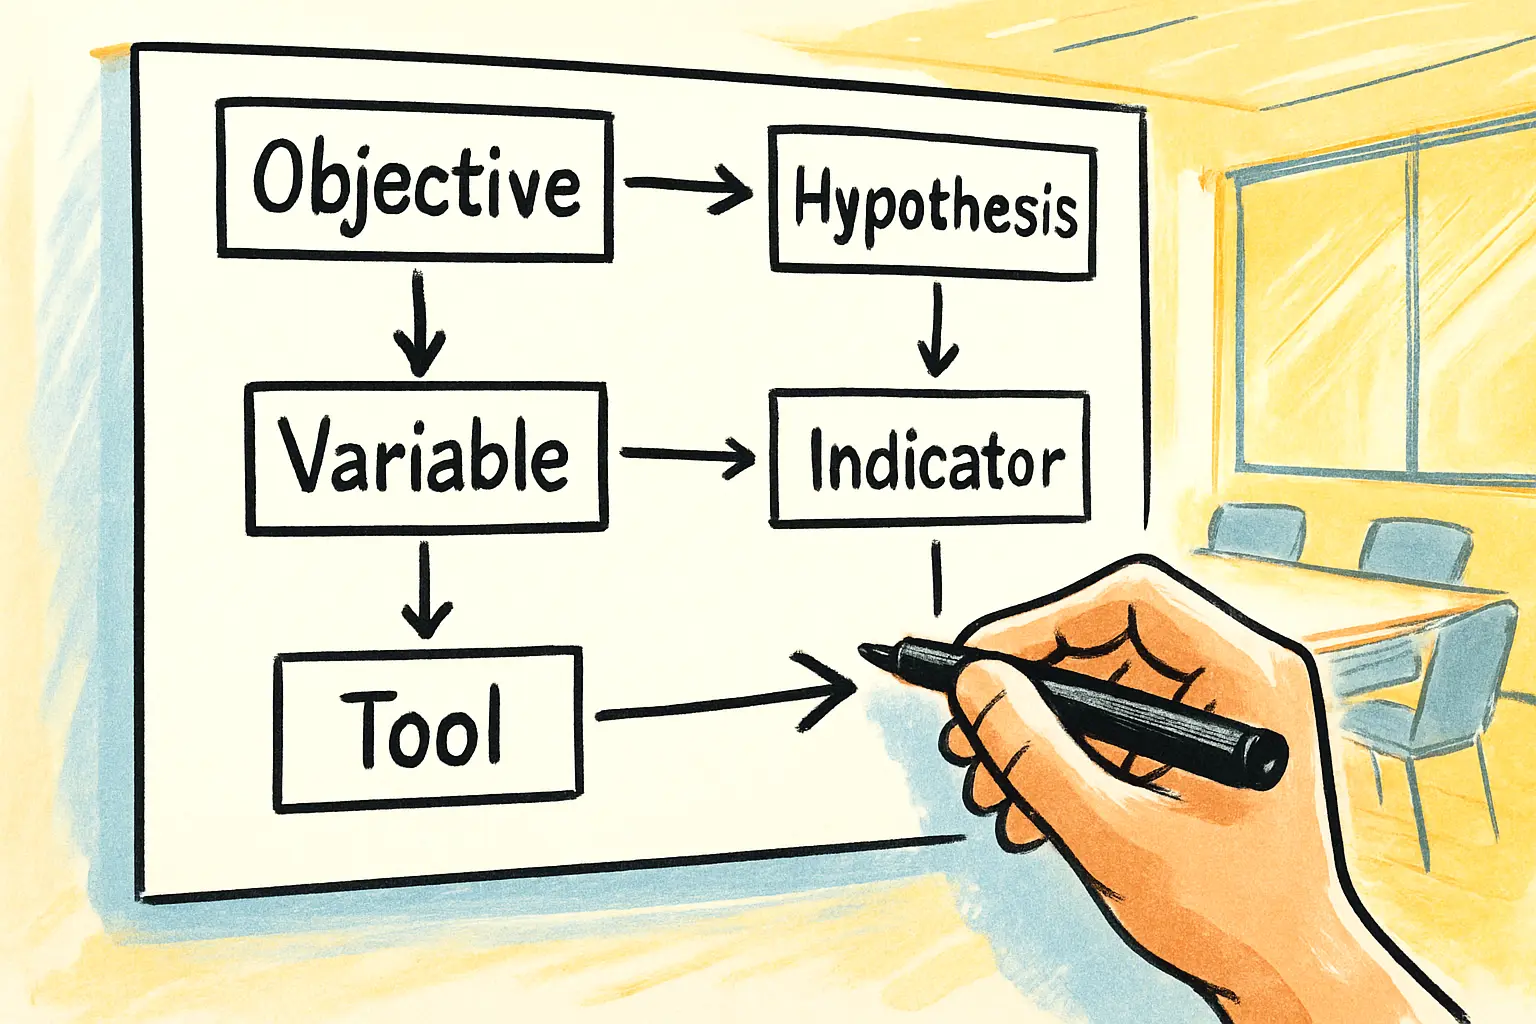
These are the same failures the site’s guide to conceptual frameworks addresses from the diagram side rather than the table side; if your guide asked for arrows between constructs rather than this six-column table, that version is built step by step in building a conceptual framework for the MBA dissertation. The two documents describe the same relationships in different shapes, and departments generally ask for one or the other, not both.
Keeping the matrix and the chapters in agreement
A matrix written in week two and never revisited is the most common source of a Chapter 1–Chapter 4 mismatch: a control variable quietly dropped, an indicator recomputed a different way, a test substituted because the data did not cooperate. Whenever a cell changes, change it in the matrix first, because the matrix is what your guide compares against the final results table. Tesify keeps the objectives, the methodology and the results chapter in one working view as the dissertation grows, so a changed indicator or test shows up against the row that named it while there is still time to reconcile the two.
Build your consistency matrix in Tesify
Frequently asked questions
What is a consistency matrix in a thesis?
A table that lines up every objective with its hypothesis, the variables the hypothesis names, the indicator that measures each variable, the data source that supplies the number, and the statistical tool that analyses it. It is used to check, before any chapter is written, that every planned claim can actually be tested with the data the study will collect.
Is this the same as a conceptual framework?
No. A conceptual framework is usually a diagram of constructs and the arrows between them. A consistency matrix is a table that goes one level more operational: it names the exact indicator, source and test behind each construct. Some departments ask for one, some for the other, and a few for both under different headings.
Do I need a hypothesis for every objective?
No. Descriptive objectives (“to describe the profile of respondents”) do not need a hypothesis. Only objectives that state or imply a relationship, difference or effect need a corresponding row with a testable hypothesis.
What if my data source changes after I submit the synopsis?
Update the matrix and tell your guide. A data-source substitution is common when an intended filing is unavailable or a survey response rate is too low for the planned test, and it is far better disclosed and revised than left inconsistent between the synopsis and the final chapters.
Can one variable appear in more than one row?
Yes, and it usually should. A control variable such as firm size often repeats across several objectives in the same dissertation; repeating it in the matrix is honest, not redundant.
How many rows should the matrix have?
One row per objective that has a testable hypothesis, plus one row for any purely descriptive objective without a hypothesis column filled in. Most accounting and finance dissertations run three to six objectives, so the matrix is usually the same length.
What is the difference between an indicator and a variable?
The variable is the concept (profitability, liquidity, investor sentiment); the indicator is the exact, computable form it takes in your study (Return on Assets computed a stated way, the Current Ratio, a named scale’s summed score). A matrix that stops at the variable and never states the indicator is incomplete.
Where does the matrix go in the dissertation?
Most Indian formats place it at the end of the introduction chapter or at the start of the methodology chapter, immediately after the objectives and hypotheses are stated. Your ordinance or your guide’s own template decides the exact placement; ask before assuming.
Does a qualitative accounting or finance study need a consistency matrix?
A qualitative or case-study design does not test hypotheses in the same sense, but an equivalent alignment table still helps: research question, the construct it explores, the evidence source (interview, document, filing) and the analysis approach (thematic coding, content analysis) in place of hypothesis, indicator and statistical test.
Can the same indicator serve two different hypotheses?
Yes. Return on Assets, for example, can appear as the dependent variable in a study of NPAs and as the dependent variable in a study of working capital, provided each row states its own hypothesis and its own independent variables clearly.