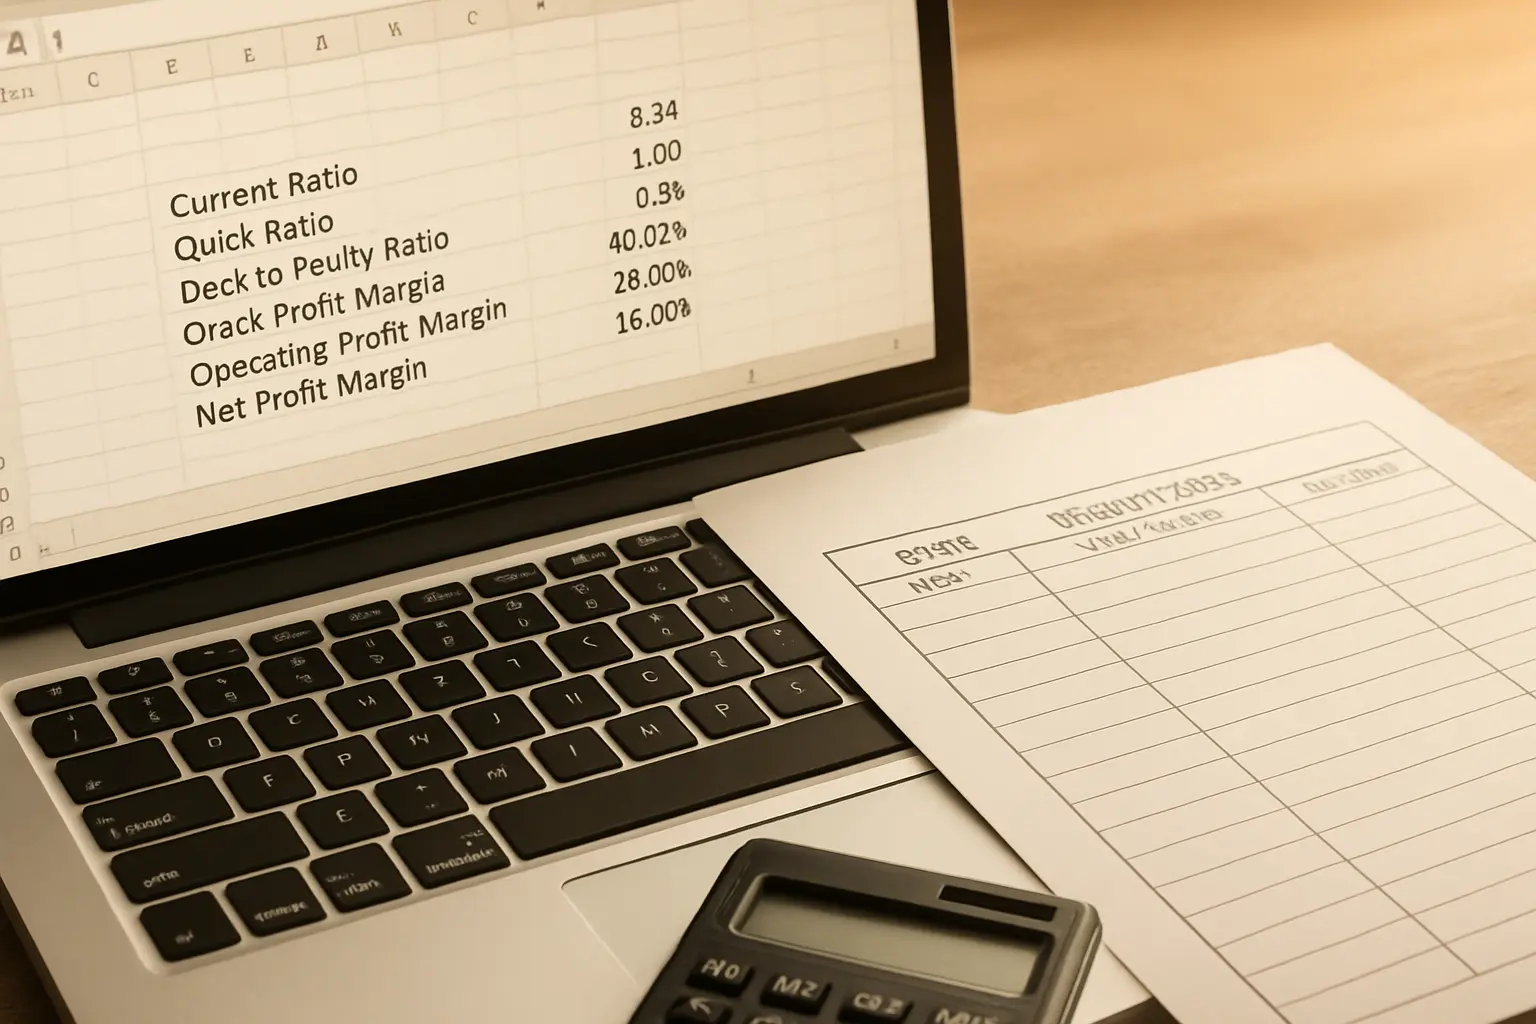
A Commerce dissertation in India usually needs two different kinds of software, not one — and picking the wrong pair is the most common reason a Chapter 3 tools section reads as an afterthought. Below is the comparison, prices verified at the vendor in September 2026, followed by which combination suits which kind of Commerce study.
| Tool | What it actually does for you | Price (India, Sept 2026) | Best for |
|---|---|---|---|
| TallyPrime | Accounting records, ledgers, financial statements — the software Indian firms and case-study organisations actually keep their books in | Silver (single-user): ₹750/month or ₹8,100/year rental; ₹22,500 perpetual + ₹4,500/year TSS renewal. Gold (multi-user): ₹24,300/year rental; ₹67,500 perpetual + ₹13,500/year TSS. 7-day free trial. | Firm-level, accounting-data dissertations (ratio analysis, working capital studies, a case-study company’s books) |
| Microsoft Excel (via Microsoft 365) | Data entry, pivot tables, basic charts, simple statistical functions | Microsoft 365 Personal: ₹6,899/year (₹689/month). Family: ₹8,199/year. Many students already have institutional access through their university’s Office 365 education licence — check before buying. | Organising survey data before analysis, quick descriptive tables, anyone on a tight budget |
| IBM SPSS Statistics | Inferential statistics — t-tests, ANOVA, regression, chi-square, reliability analysis — with a menu-driven interface that needs no coding | Subscription from $99/month (base) for a commercial licence; academic/student licences and campus-wide editions exist at separate, lower academic pricing not listed publicly — ask your department if a campus licence already covers you before paying anything. | Survey-based Commerce dissertations testing relationships or group differences (financial literacy, consumer behaviour, digital-payment adoption) |
| Google Forms + Google Sheets | Free primary-data collection and light tabulation | Free with any Google account | Collecting your own survey responses before they go into SPSS or Excel |
The Two Study Types, and Which Tools Each One Needs
Almost every Commerce dissertation topic falls into one of two shapes, and the shape decides the tool, not the other way round.
- Firm-level, accounting-data studies — profitability determinants, working capital and liquidity analysis, capital structure, dividend policy, a named company’s financial ratios over a period. These pull numbers from published annual reports or, in a case-study format, from a cooperating firm’s own books. TallyPrime matters here specifically because it is what Indian firms actually use to keep those books — if your case-study organisation exports data from Tally, being able to open, sort and cross-check that export yourself (rather than trusting a printout) is a real research skill, not a formality. Once the raw figures are extracted, Excel does the ratio calculations and the trend tables that go into Chapter 4.
- Survey-based, primary-data studies — financial literacy among a defined group, consumer behaviour, digital payment adoption, service-quality perception. These need a scale-based questionnaire, a defined sample, and inferential statistics that test a hypothesis rather than just describe a pattern. Google Forms collects the responses free; SPSS (or a free alternative, see below) runs the reliability check and the hypothesis tests. Where the introduction and abstract for either study type should land is covered in our guide to writing the abstract and introduction of a Commerce dissertation.
A third, smaller category worth naming: some Commerce dissertations blend the two, using a firm’s Tally-derived ratios as context alongside a short survey of stakeholders’ perceptions of that firm’s performance. This mixed design needs both toolsets, stated separately in Chapter 3 rather than blurred together, so a reader can tell which finding came from which data source.
Reading a Tally Export Yourself, Step by Step
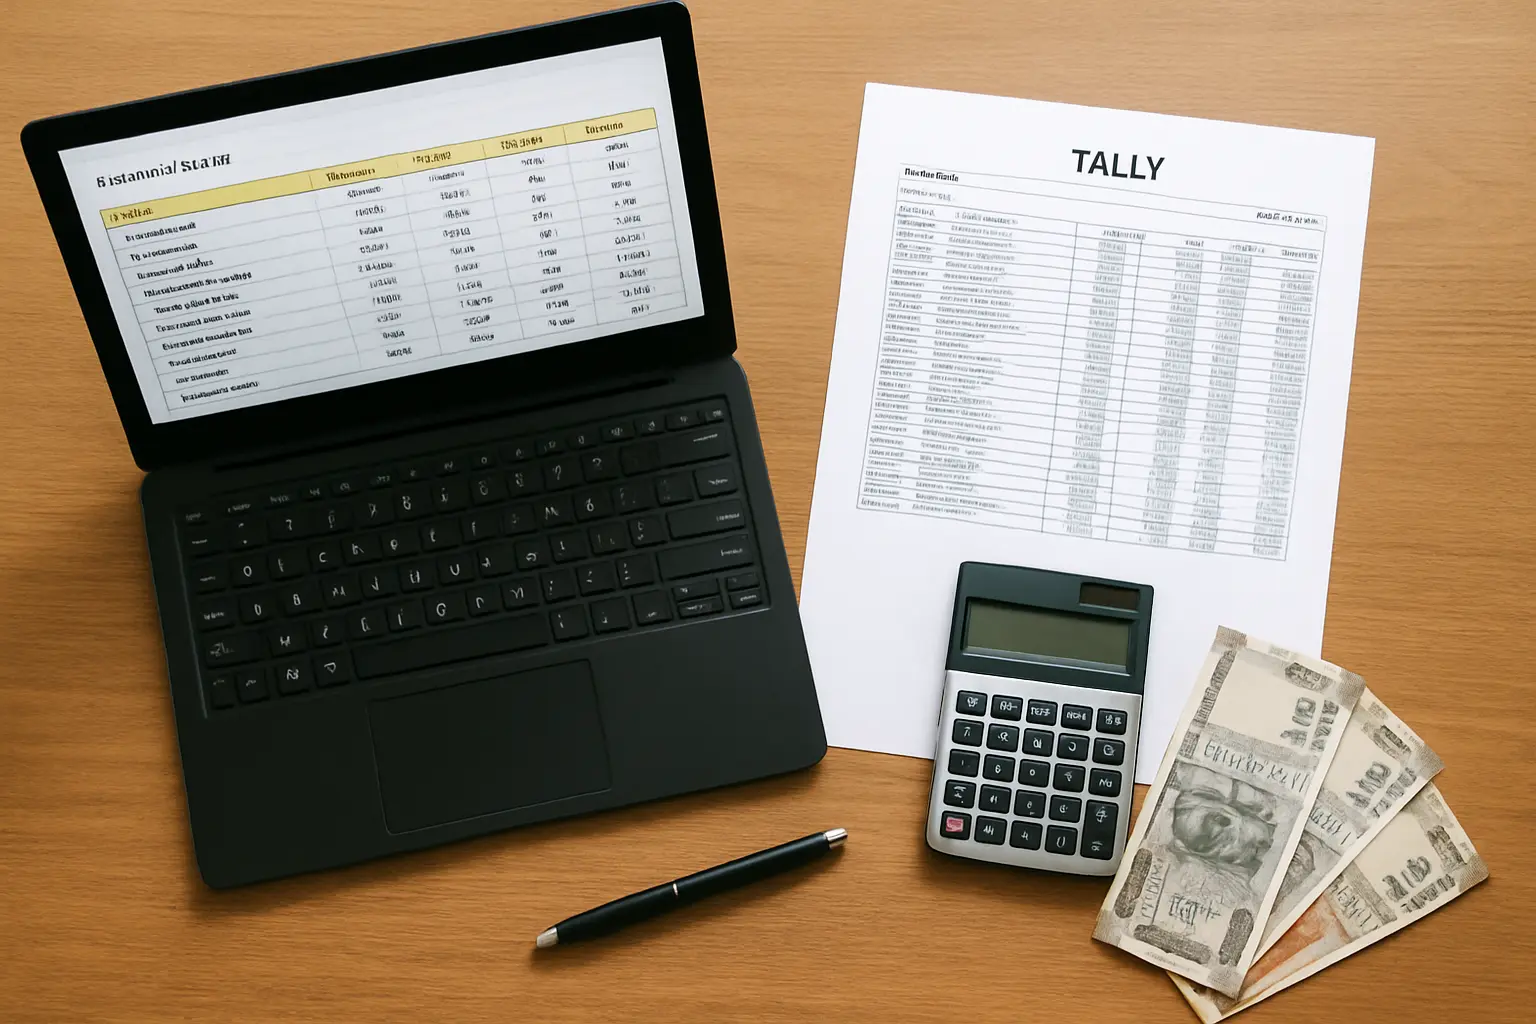
Most Commerce case-study dissertations do not require installing Tally at all — they require being able to work with data a cooperating firm has already exported from it. Knowing the shape of that export saves a week of confusion in Chapter 3.
- Ask for the export format explicitly. Tally exports to Excel, XML or PDF; ask the organisation for Excel, since XML needs conversion and a PDF export of a ledger is far harder to re-tabulate accurately.
- Confirm the reporting period and the report type. A trial balance, a profit and loss statement, and a balance sheet are three different reports; state in your methodology chapter exactly which ones you received and for which financial years.
- Cross-check one figure by hand. Before building ratios on the exported data, manually verify one or two line items against the organisation’s published annual report, if one exists, to confirm the export was not corrupted or from the wrong period.
- Compute your ratios in Excel, with the formula visible in the cell, not hard-typed as a number — a formula an examiner can click into and inspect is stronger evidence than a static figure, and it lets you re-run every calculation instantly if a source number is corrected.
- Keep the raw export as an appendix, or at minimum retain it, since a data-source query at the viva is answered fastest by pointing to the original file.
None of this requires an active Tally licence if the organisation does the export for you — the 7-day free trial is enough only if you need to open and re-export the file yourself rather than receiving it ready-made.
Ranked Shortlist
- TallyPrime — for any Commerce dissertation that touches real accounting data. It suits case-study and firm-level topics precisely because it is the software the data actually lives in; it falls short for anything survey-based, where it has no role at all. The 7-day free trial is enough to explore the interface and confirm your case-study organisation’s export format before committing to a rental plan.
- Microsoft Excel — the one every Commerce dissertation uses regardless of topic. It suits pivot tables, ratio calculations, and any chart your department expects in Chapter 4; it falls short as the only tool for a dissertation that tests hypotheses, since Excel’s built-in statistical functions are thin compared with a dedicated package. Check your university’s Office 365 education licence before paying for Microsoft 365 personally — most Indian universities already provide one.
- IBM SPSS Statistics — for survey-based Commerce dissertations that test relationships. It suits reliability analysis, t-tests, ANOVA and regression with no coding required, which matters when your dissertation timeline does not include learning R or Python from scratch; it falls short on price for a student paying out of pocket at commercial rates, so check your department’s campus licence first — most Indian commerce and management departments that require SPSS provide one, and paying the commercial rate directly is rarely necessary. Reliability evidence from whichever package you use is reported the same way, and what counts as an acceptable Cronbach’s alpha is a range, not a single pass mark.
- Jamovi or JASP — the free alternative worth knowing about. Both are free, open-source statistical packages with a menu-driven interface close enough to SPSS that switching costs little, and both run the same core tests (t-tests, ANOVA, regression, reliability). Neither has SPSS’s institutional name recognition, which occasionally matters to an examiner who expects to see “SPSS” named in Chapter 3 — ask your guide whether the specific package matters or only the analysis itself.
- Google Forms and Sheets — free, and good enough for data collection. They suit gathering primary survey data at zero cost; they fall short as an analysis tool once you need anything beyond a simple average or percentage, which is why the data typically moves to Excel or SPSS immediately after collection. How many responses that survey actually needs is a separate question, covered in our guide to calculating sample size for a thesis.
One Clear Recommendation
If your dissertation is firm-level and accounting-based: get comfortable reading a Tally export and do the analysis in Excel — you likely do not need SPSS at all. If your dissertation is survey-based: collect with Google Forms, organise in Excel, and analyse in SPSS if your department provides a licence, or in Jamovi if it does not and the specific software name is not itself a requirement. Confirm which case applies to your topic before you spend a rupee on any paid tool.
What Examiners Actually Check in the Tools Section
- That the tool named in Chapter 3 matches what actually produced the tables in Chapter 4 — a methodology chapter that names SPSS while Chapter 4’s charts were clearly built in Excel is an inconsistency examiners notice.
- That a Tally-sourced figure is traceable to a specific report or export, not quoted without a date or source line.
- That reliability evidence (Cronbach’s alpha, for a survey-based study) is reported for your own sample, not copied from the instrument’s original validation paper.
- That a price or subscription figure quoted anywhere in your own literature review or introduction (if you cite one) carries the date it was checked, exactly as the comparison above does — an unattributed cost figure ages badly and is easy to catch.
Common Mistakes in a Commerce Dissertation’s Tools Section
- Naming a tool in Chapter 3 that never actually appears in Chapter 4. If SPSS is listed but every table looks like a plain Excel pivot table, an examiner will ask why.
- Quoting a Tally-derived figure with no date or reporting period attached. “Revenue was ₹[x] crore” means nothing without the financial year it belongs to.
- Assuming SPSS is compulsory when the department only requires the analysis, not the specific brand. Ask before ruling out a free alternative on the assumption that it will not be accepted.
- Treating Google Sheets formulas as a substitute for a named statistical test. A Sheets average is descriptive, not inferential — if your objective requires testing a hypothesis, an average alone does not answer it.
- Buying a personal Microsoft 365 or SPSS licence before checking what your university already provides. The most common wasted expense in a Commerce dissertation’s tools budget — reference management software is the other line item worth checking against your library first, as our honest shortlist of reference managers for Indian researchers covers.
Frequently Asked Questions
Do I need Tally for a survey-based Commerce dissertation?
No. Tally is relevant only when your data comes from accounting records — a firm’s books, a case-study organisation’s financial statements. A consumer-behaviour or financial-literacy survey has no use for it.
Can I use Excel instead of SPSS for hypothesis testing?
Excel can run a basic t-test or correlation with its Analysis ToolPak add-in, but it lacks the reliability analysis, post-hoc tests and regression diagnostics that a dissertation-level study typically needs. Use Excel for organisation and descriptive tables; use a dedicated statistical package for hypothesis testing.
Is there a genuinely free alternative to SPSS?
Yes — Jamovi and JASP are both free, open-source and cover the standard tests an undergraduate or postgraduate Commerce dissertation needs. Confirm with your guide whether SPSS is specifically required by your department’s format before switching.
Does my university library give free access to any of these tools?
Check before paying for anything. Many Indian commerce and management departments hold a campus-wide SPSS licence, and most universities provide students an Office 365 education subscription that includes Excel at no extra cost.
How do I cite Tally or SPSS as a tool in my methodology chapter?
Name the software and version you used (for example, “TallyPrime 5.0” or “IBM SPSS Statistics 29”), not just the brand — a version number is part of making your method reproducible.
Can I mix Tally-sourced and survey-based data in one dissertation?
Yes, and it is common in a comparative or case-study-plus-perception design — for example, a firm’s actual financial ratios alongside a survey of its customers’ perceptions. State both data sources and both toolsets separately in Chapter 3.
Tesify keeps your Chapter 3 tools section consistent with what actually produced your Chapter 4 tables, whichever combination of Tally, Excel, SPSS or a free alternative your topic needs.