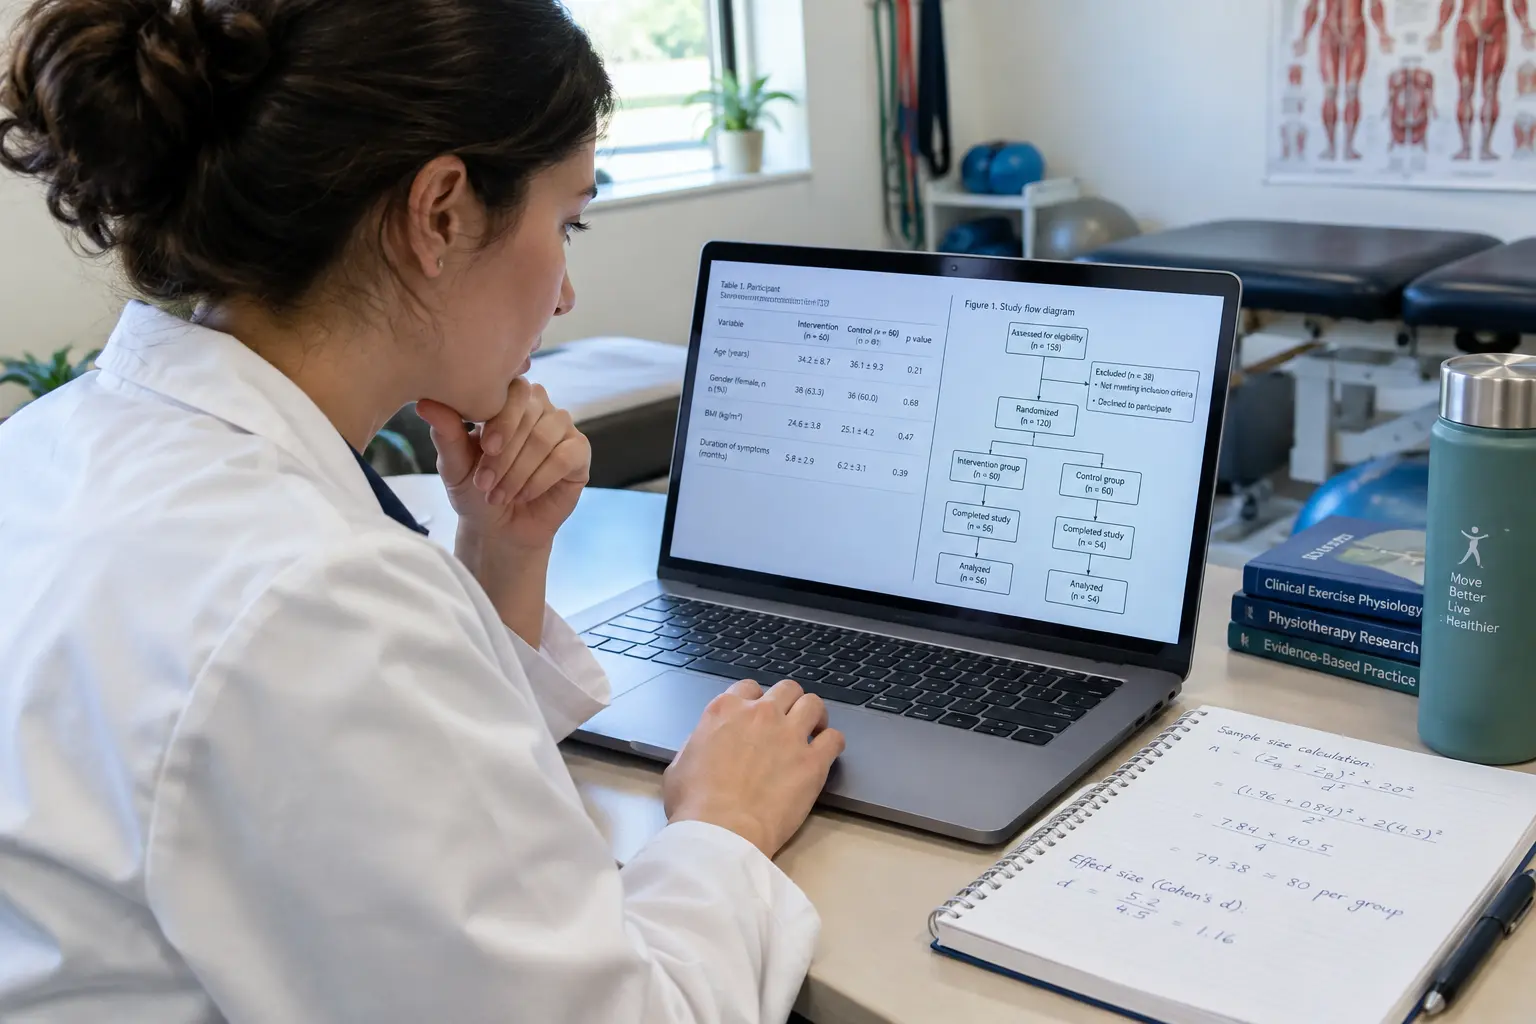
A physiotherapy dissertation’s results chapter should report a CONSORT-style participant flow diagram, descriptive statistics (mean, SD, n) for every outcome measure before any inferential test, the exact test statistic with degrees of freedom and p-value, and an effect size with its confidence interval — not p-values alone. Many Indian physiotherapy dissertations lose marks at exactly this chapter, not because the intervention failed, but because the results are narrated in prose instead of laid out in the tables and figures an examiner expects to check against the raw numbers.
The Reporting Standard: What CONSORT Actually Requires
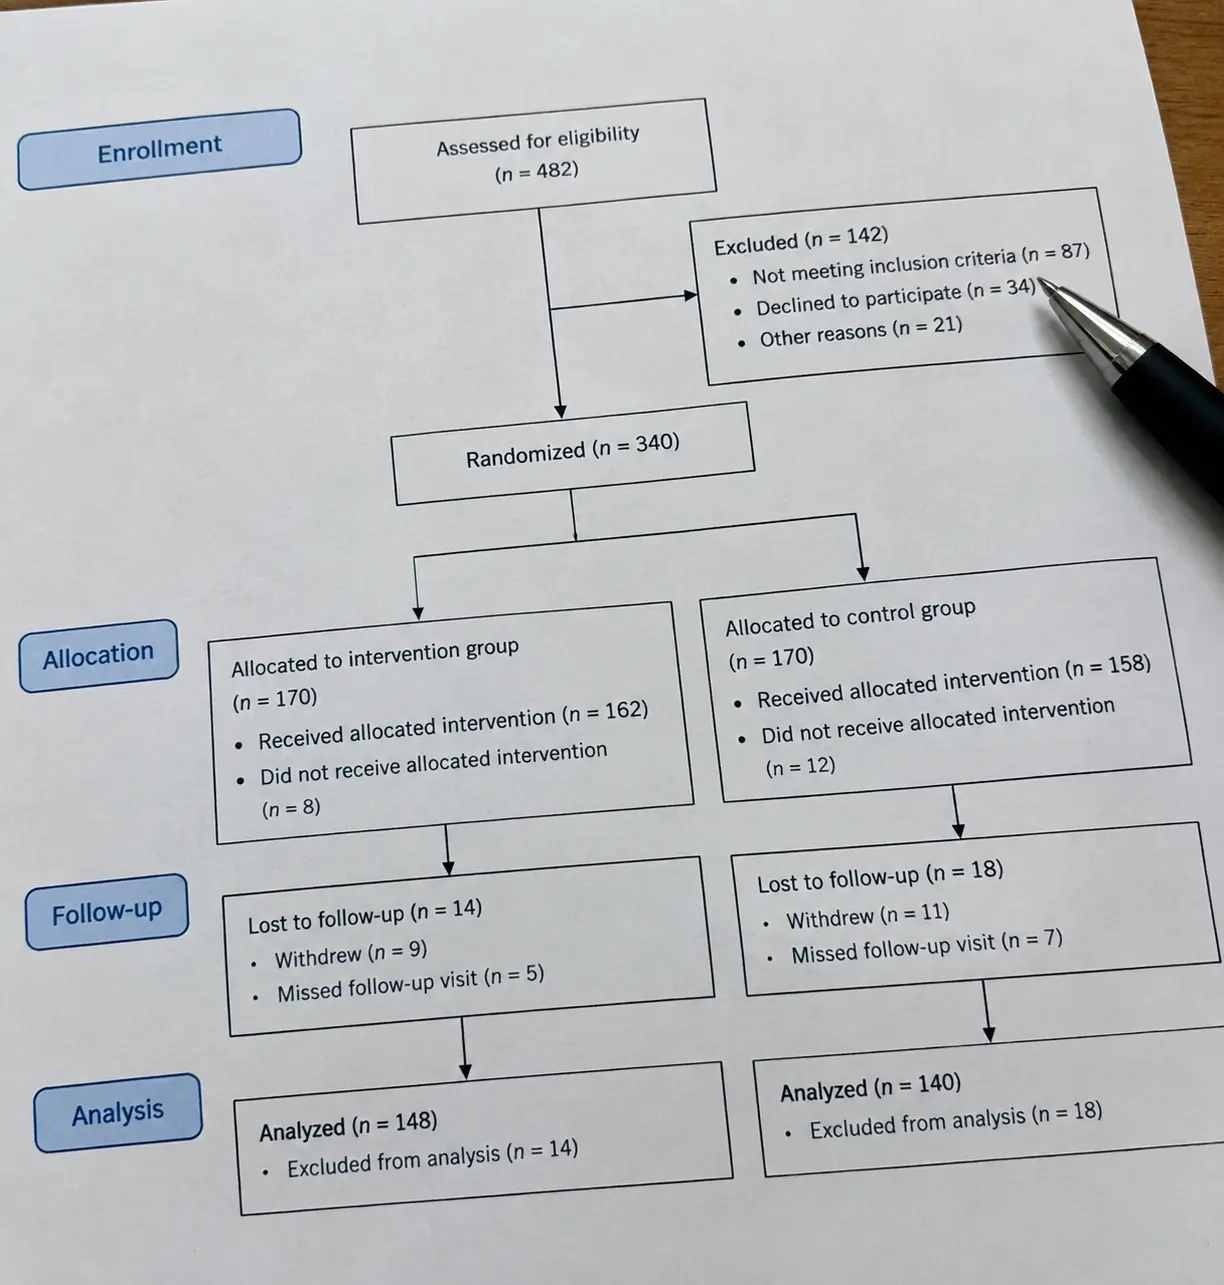
The CONSORT Statement is an evidence-based, minimum set of recommendations for reporting the results of randomised trials, with two required components: a 30-item checklist covering how the trial was designed, analysed and interpreted, and a flow diagram showing the progress of every participant through the trial. CONSORT materials are freely available; the current version is CONSORT 2025, a comprehensive update funded by the MRC-NIHR Better Methods, Better Research initiative. A physiotherapy dissertation testing an intervention — even a small-scale, single-centre quasi-experimental study rather than a full multi-site RCT — should adapt the CONSORT flow diagram: participants assessed for eligibility, excluded (with reasons), randomised or allocated, received the intervention, lost to follow-up (with reasons), and analysed. Reviewers recognise this shape immediately, and its absence is conspicuous.
| Element | What CONSORT requires | What Indian dissertations often omit |
|---|---|---|
| Participant flow diagram | Every stage from eligibility screening to final analysis, with numbers and reasons at each exclusion point | Only the final analysed sample size, with no account of screening or dropout |
| Baseline characteristics table | Demographic and clinical variables compared across groups before the intervention | Baseline data mentioned in prose rather than tabulated |
| Outcome data | Descriptive statistics for every outcome, every group, every time point | Only the primary outcome’s post-intervention value |
| Effect size and confidence interval | Reported alongside the p-value, not instead of it | p-value alone, with no effect size |
| Harms/adverse events | Any adverse events during the intervention, even if none occurred | No mention either way |
What Goes in the Results Chapter, Section by Section
A physiotherapy dissertation’s Chapter 4 (Results) typically follows this order, matching the CONSORT logic: participant flow and recruitment (the diagram itself, plus text on the screening period and recruitment setting); baseline/demographic characteristics (a table comparing groups on age, sex, BMI, baseline severity or the relevant clinical measure — the point is to show the groups were comparable before the intervention, which justifies attributing later differences to it); primary outcome results (descriptive statistics at every time point measured — pre-intervention, post-intervention, and any follow-up — for every group); secondary outcome results, presented the same way; the inferential statistics that test the hypothesis, matched to the design (paired t-test for a single-group pre-post design, independent t-test or ANOVA for a between-groups comparison, non-parametric equivalents where normality assumptions fail); and any adverse events or protocol deviations.
How to Present a Table That Survives a Viva
Every results table needs, without exception: the exact n for each cell (not just the total sample size), mean and standard deviation (or median and interquartile range for non-normal data), the test statistic with its degrees of freedom, the exact p-value (not just “p < 0.05” — report “p = 0.031” so a reader can judge how close to the threshold it actually was), and the effect size with its confidence interval. A worked illustrative example, labelled fictional: a table reporting knee range-of-motion outcomes for a pre-test/post-test physiotherapy study might read “Pre-intervention: 82.4° (SD 6.1, n = 24); Post-intervention: 94.7° (SD 5.3, n = 22); paired t(21) = 8.62, p < .001, Cohen’s d = 1.76, 95% CI [1.21, 2.29].” Every number in that sentence is independently checkable against the raw data — that is what makes it defensible, and no real study’s figures are implied by using it as a template. The general APA conventions for results tables and figures across all fields are set out in our guide to writing the results chapter; this article applies them to the physiotherapy intervention study specifically.
Figures: When a Chart Earns Its Place
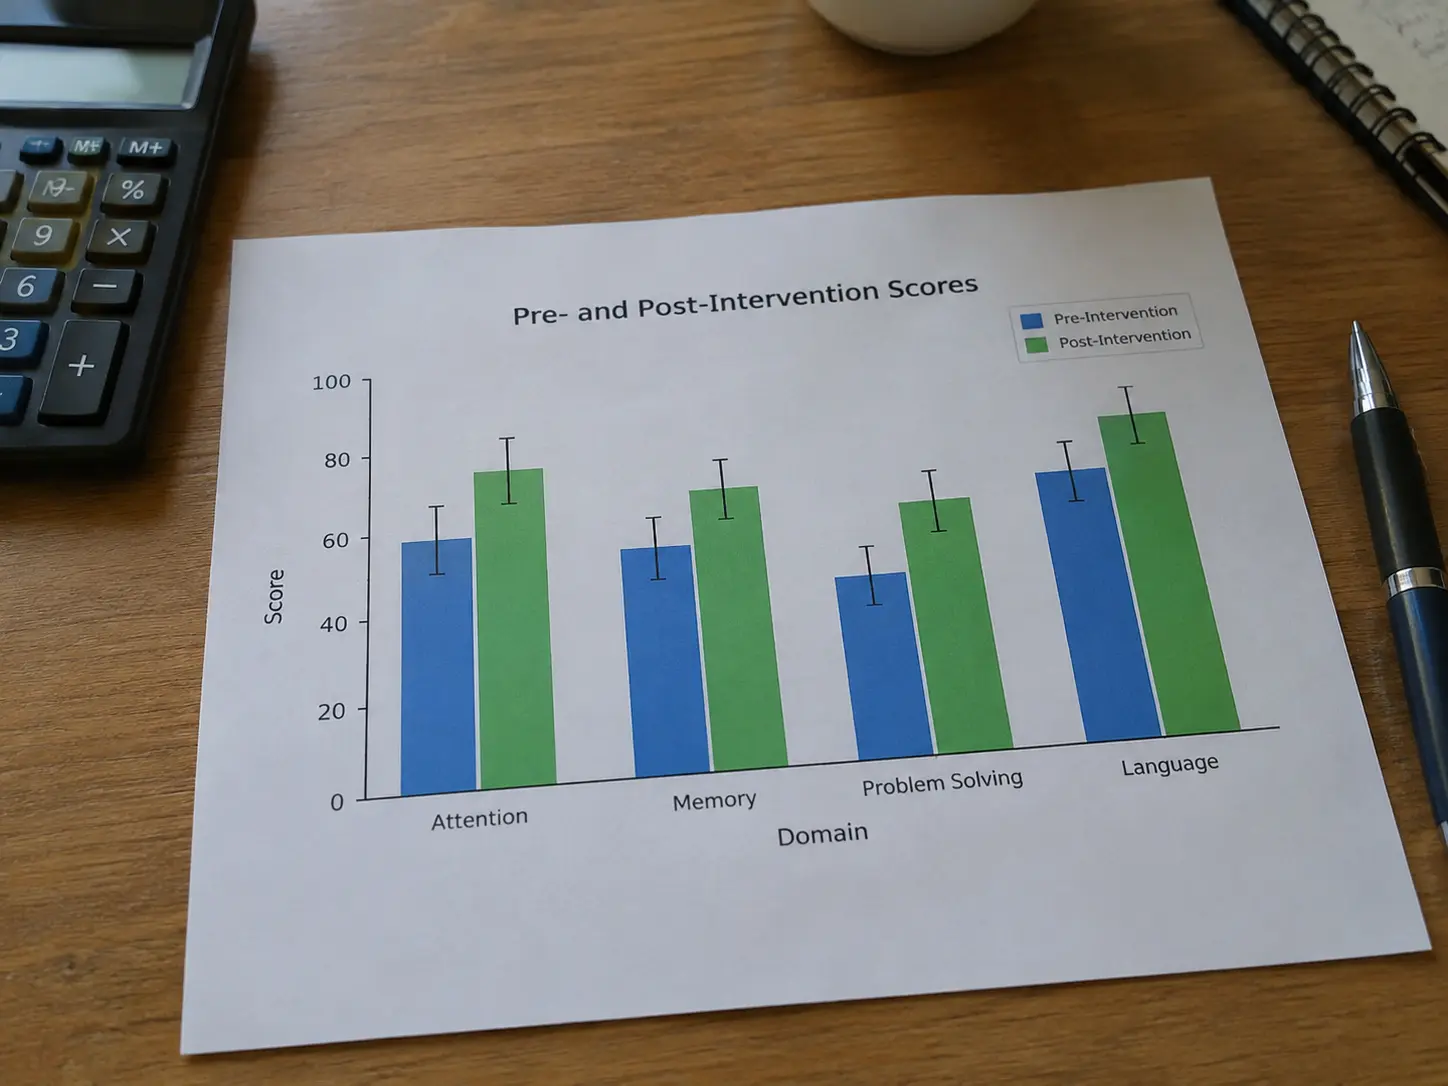
Not every result needs a figure — a two-group, one-time-point comparison is often clearer as a table than as a bar chart. Figures earn their place when they show a pattern a table hides: a line graph across multiple time points (showing trajectory, not just endpoints), a box plot when the spread and outliers matter as much as the mean, or a forest plot if you are pooling results across several outcome measures or sub-groups. Every figure needs axis labels with units, a legend distinguishing groups, error bars with a stated type (SD, SE, or 95% CI — state which, because they look identical but mean different things), and a caption that states the n and the statistical test without requiring the reader to hunt through the text.
If Your Design Is Quasi-Experimental, Not a True RCT
Many Indian BPT and MPT dissertations are quasi-experimental — a single group measured pre- and post-intervention, or two non-randomly allocated groups (say, patients from two different clinic days) rather than a true randomised controlled trial with allocation concealment. This is a legitimate and common design given the timeline and resources of a postgraduate dissertation, and it does not need to apologise for not being an RCT — but the results chapter should state the allocation method plainly (convenience, alternate allocation, or randomisation, whichever it actually was) rather than let the CONSORT-style flow diagram imply randomisation that did not happen. The limitations section is where this belongs explicitly: a quasi-experimental design cannot rule out confounding from non-random allocation the way a true RCT can, and saying so is a mark of methodological literacy, not a weakness to hide.
Matching the Statistical Test to a Physiotherapy Design
The design a physiotherapy dissertation actually runs decides the test, not the other way round: a single-group pre-test/post-test design (the commonest in resource-limited student projects) calls for a paired-samples t-test if the difference scores are normally distributed, or the Wilcoxon signed-rank test if they are not; a two-group post-test-only or pre-post design calls for an independent-samples t-test or Mann-Whitney U; more than two groups or repeated measures across several time points call for ANOVA (repeated-measures ANOVA for within-subject designs) or its non-parametric equivalents (Kruskal-Wallis, Friedman). Report which normality check you ran (commonly Shapiro-Wilk for small samples) and state the outcome before naming which test you used — the test choice should visibly follow from that check, not precede it. The same logic across every design type is laid out as a decision table in our guide to choosing a statistical test for a thesis.
Reporting a Non-Significant Result Honestly
A physiotherapy intervention study that finds no significant difference is not a failed dissertation — but it is written very differently from a positive result, and the difference matters at the viva. State the exact p-value and effect size exactly as you would for a significant finding; do not omit the effect size because the p-value crossed the threshold, since a small sample with a genuinely meaningful effect size that missed significance is a different (and more defensible) finding than a genuinely null result. Where the sample size was small, name that limitation explicitly rather than let the reader infer it, and if a power calculation was done at the proposal stage, report the achieved power against it. “No significant difference was found (p = .18), though the observed effect size (d = 0.34) suggests the study may have been underpowered to detect a moderate effect at this sample size (n = 18 per group)” is a defensible sentence; “the intervention was not effective” from the same data is not — it overstates what a single underpowered study can actually conclude.
What Sends a Physiotherapy Results Chapter Back
- p-values with no effect size. A statistically significant result with a trivial effect size, or a large effect that misses significance in a small sample, both need the effect size stated to be interpretable at all.
- No participant flow accounting. Reporting only the final analysed n hides dropout and screening exclusions that examiners specifically ask about.
- Results narrated only in prose, with no tables — an examiner should not have to extract numbers from a paragraph to check your arithmetic.
- A statistical test that does not match the design — an independent-samples test applied to paired pre/post data from the same participants is a common, examiner-visible error.
- “p < 0.05” everywhere with no exact value — examiners specifically probe how close borderline results sat to the threshold.
How Does This Differ From the Outcome-Measures and Literature-Review Guides?
Which validated scale to choose in the first place — VAS, the Oswestry Disability Index, the Berg Balance Scale, and five others compared by condition — is covered separately in our guide to choosing an outcome-measure scale for a physiotherapy dissertation; this article assumes that choice is already made and picks up at the next step: presenting the data that instrument produced. The literature-review stage earlier still is covered in our physiotherapy literature review guide, which also introduces the PEDro scale for grading the quality of the clinical evidence your own study builds on. The Chapter 3 methodology write-up itself — design, sampling and procedure — sits between those two and this one in the thesis’s own chapter order.
Turning a results log into tables and a flow diagram an examiner can check line by line is exactly the structuring work that eats the week before submission. Tesify helps you lay out your results chapter to the CONSORT logic, with every table and figure format handled consistently. Used by 9,000+ students. Write your thesis with Tesify.
Frequently asked questions
Do I need a full CONSORT flow diagram for a small student physiotherapy study?
Adapt it rather than skip it — even a single-centre, non-randomised pre-post design benefits from showing screened, excluded, enrolled, lost-to-follow-up and analysed counts. The full 30-item checklist is for formal RCTs, but the flow-diagram logic applies to almost any intervention study.
Is a p-value alone ever enough to report?
No — CONSORT asks for the estimated effect size and its precision, such as a 95% confidence interval, for each outcome, and physiotherapy examiners increasingly expect the same, because a p-value alone does not say how large or clinically meaningful the difference was.
Which statistical test fits a single-group pre-test/post-test physiotherapy study?
A paired-samples t-test if the difference scores are normally distributed, or the Wilcoxon signed-rank test if they are not. Report which normality check you ran and its result before naming the test.
Should error bars show SD, SE, or a confidence interval?
Any of the three can be valid, but the figure caption must state which one — they represent different things and look identical on a chart, which is why the caption is not optional.
What is the difference between this results-chapter guide and the Chapter 3 methodology sample on this site?
Chapter 3 covers the design, sampling and procedure that produce the data; this guide covers how to present that data once collected — a different chapter, a different job.
How many decimal places should a p-value have?
Report the exact value to three decimal places (or “p < .001” once it falls below that), rather than only stating “significant” or “p < 0.05” — the exact figure lets an examiner judge how close a borderline result actually was.
Do I need a table AND a figure for the same result?
Not usually — pick whichever presents the result more clearly and use the other only if it adds genuinely new information, such as a trend across time points a table would bury in rows.
What if my data fails the normality assumption?
Switch to the non-parametric equivalent of your planned test — Wilcoxon instead of paired t-test, Mann-Whitney instead of independent t-test, Kruskal-Wallis instead of one-way ANOVA — and report the normality test and its result so the switch is visibly justified, not arbitrary.