
| What your hypothesis asks | Test | Typical accounting/finance use |
|---|---|---|
| Is there a relationship between two continuous financial variables? | Pearson or Spearman correlation | Leverage and profitability; firm size and disclosure quality |
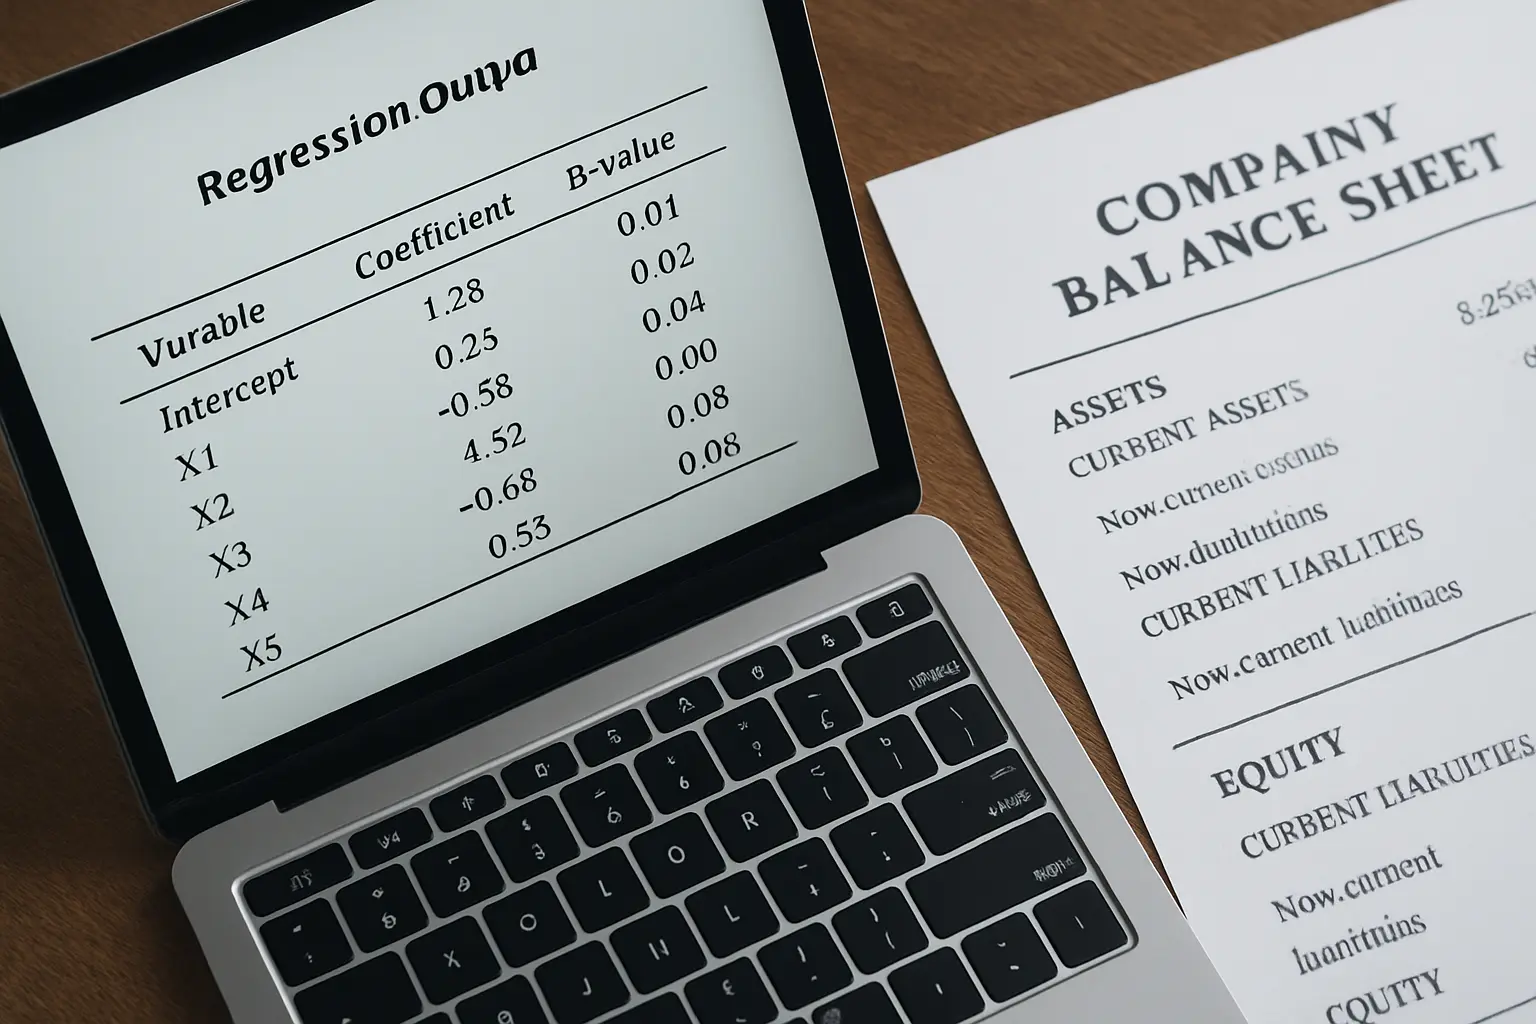
| Does one or more variables predict a financial outcome? | Multiple linear regression | Determinants of ROA; capital structure and firm value |
| Does the outcome vary across firms AND over time in a panel dataset? | Panel regression (fixed-effects or random-effects) | NPA and bank profitability across banks and years; ESG score and valuation across firms and years |
| Is there a significant difference between two groups’ means? | Independent-samples t-test (or Mann-Whitney U if not normal) | Profitability of public vs private sector banks; audited vs unaudited firm disclosure quality |
| Did a metric change significantly before and after an event, for the same firms? | Paired t-test (or Wilcoxon signed-rank if not normal) | Profitability before and after a merger; working capital ratios before and after a policy change |
| Does a metric differ across three or more groups? | One-way ANOVA (or Kruskal-Wallis if not normal) | Profitability across industry sectors; disclosure scores across ownership types |
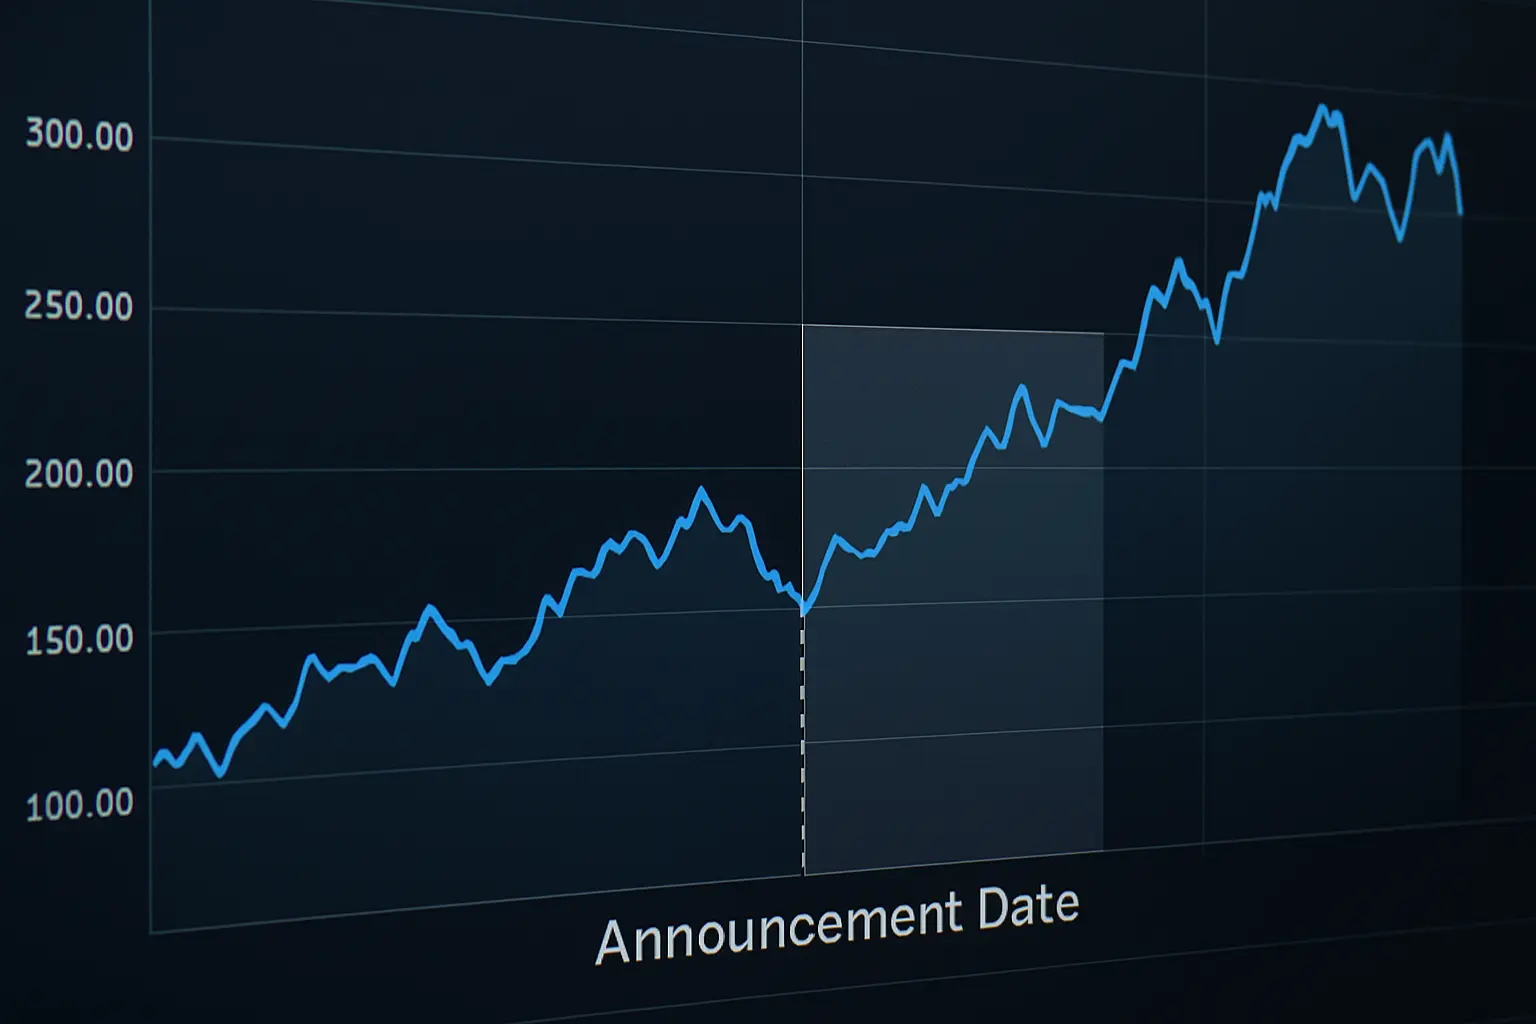
| Did a stock’s returns react abnormally around a specific announcement? | Event study (cumulative abnormal returns, CAR) | Stock-price reaction to earnings announcements, dividend declarations, M&A news |
| Is a time series stationary, and are two series related over time? | Unit root test (ADF), cointegration, Granger causality | Exchange rate and stock index relationship; inflation and interest rate dynamics |
| Is there an association between two categorical variables? | Chi-square test of independence | Audit opinion type and firm size category; credit rating category and industry |
The test is chosen by what your hypothesis actually claims, not by which test you already know how to run in Excel or SPSS. A regression run on a hypothesis that only asked whether two group means differ is the wrong test correctly executed, and examiners in accounting and finance dissertations probe this specific mismatch more than almost any other methodological weakness.
The criteria used here
- What the hypothesis actually asks — a relationship, a prediction, a group difference, a before-after change, or a time-series pattern.
- The data structure — a single cross-section, a panel of firms over years, an event window around an announcement date, or a macro time series.
- Whether the data meets the test’s assumptions — normality for a parametric test, stationarity for a time-series test — and the non-parametric or transformed alternative when it does not.
Correlation and regression — the relationship workhorses
Pearson correlation measures the linear relationship between two continuous variables and needs roughly normally distributed data; Spearman’s rank correlation is the non-parametric alternative when that assumption fails or your variables are ordinal. Multiple linear regression extends this to predicting one financial outcome from several variables at once — the standard tool for a “determinants of X” accounting or finance dissertation, such as the determinants of dividend payout ratio or the determinants of audit fees. Check the regression’s own assumptions before trusting the coefficients: linearity, no severe multicollinearity (a variance-inflation-factor check), homoscedasticity of residuals, and independence of errors.
Panel regression — when your data has both firms and years
Most Indian accounting and finance dissertations that pull data from several companies’ financial statements over several years have panel data, not a simple cross-section, and a plain OLS regression on pooled panel data ignores that structure. Fixed-effects panel regression controls for firm-specific characteristics that do not change over time (management quality, industry positioning); random-effects panel regression is appropriate when those firm-specific effects are assumed uncorrelated with the predictors. A Hausman test is the standard way to decide between the two, and stating that you ran it — and which model it favoured — is exactly the kind of methodological detail an examiner checks for in a panel-data dissertation.
Group-comparison tests — t-tests and ANOVA
An independent-samples t-test compares means between two unrelated groups (public-sector versus private-sector banks, for instance); a paired t-test compares the same firms’ metric at two points in time (before and after a merger, a regulatory change, or a policy intervention). Both assume roughly normal data within each group; where that assumption fails, particularly with small samples common in Indian sector-specific studies, the Mann-Whitney U test (independent groups) or the Wilcoxon signed-rank test (paired data) are the non-parametric substitutes, comparing distributions rather than means. One-way ANOVA extends the independent t-test to three or more groups — comparing profitability across five industry sectors, for example — with the Kruskal-Wallis test as its non-parametric counterpart.
Event study methodology — the finance-specific technique
An event study is the standard method for asking whether a stock’s returns reacted abnormally around a specific corporate announcement — an earnings release, a dividend declaration, a merger announcement, a regulatory action. The core steps: define the event date and an estimation window before it (typically 120 to 250 trading days) to model normal expected returns using a market model; define a short event window around the announcement (commonly a few days either side); compute the abnormal return for each day as the actual return minus the expected return; sum these into a cumulative abnormal return (CAR) across the event window; and test whether the CAR is statistically significantly different from zero, typically with a t-test on the standardised CAR. This is the go-to method for any finance dissertation asking whether the market reacted to a specific piece of news, and it is a distinct technique from the group-comparison and regression tests above — naming it correctly in your methodology chapter (as an “event study using the market model” rather than a vague “statistical analysis”) signals real familiarity with finance research design.
Time-series tests — when your data is a single series over time
A macro-finance dissertation examining, say, the relationship between exchange rates and a stock index over monthly data spanning years needs a different toolkit again. A unit root test (commonly the Augmented Dickey-Fuller, or ADF, test) checks whether a time series is stationary — a precondition for most time-series regression techniques, since regressing one non-stationary series on another can produce a spurious, meaningless relationship. Where two non-stationary series share a long-run equilibrium relationship, a cointegration test (commonly the Johansen test) is the correct tool rather than a standard regression. Granger causality testing then asks whether past values of one series help predict another, which is a statistical, predictive notion of “causality” rather than a claim about true causal mechanism — state that distinction explicitly in your discussion chapter, since conflating the two is a common examiner objection.
Chi-square — when both variables are categories
Where both your variables are categorical rather than continuous — audit opinion type (qualified versus unqualified) against firm size category (small, medium, large), for instance — the chi-square test of independence is the standard tool, checking whether the observed distribution across category combinations differs from what independence would predict.
A decision path to work through
- Is your outcome variable continuous or categorical? Categorical outcome against a categorical predictor points to chi-square; continuous points onward.
- Is your data a single cross-section, a panel, an event window, or a time series? This decides between plain regression, panel regression, an event study, or time-series tests.
- Are you comparing groups, or testing a relationship/prediction? Comparing groups points to t-tests or ANOVA (or their non-parametric equivalents); a relationship or prediction points to correlation or regression.
- Does your data meet the chosen test’s assumptions? Check normality (Shapiro-Wilk or a Q-Q plot) for parametric tests and stationarity (ADF) for time-series tests before trusting the result; switch to the non-parametric or transformed alternative where the assumption clearly fails.
The generic version of this decision logic, covering the tests common across every discipline on this site, is in our decision table for choosing a statistical test; what this page adds is the finance-specific toolkit — panel regression, event studies and time-series tests — that a generic table does not cover. Once your test is chosen, the software to run it in is compared in our guide to statistical tools for an Indian thesis: SPSS vs R vs JASP vs Excel, and the six-column table linking each objective to its variable, indicator and this exact test is worked through in our guide to a consistency matrix for an accounting and finance dissertation.
Frequently asked questions
Do I need panel regression if I only have data from one company over several years?
No — a single company across years without cross-sectional variation is a time series, not a panel, and needs time-series methods (checking stationarity first) rather than panel regression, which requires multiple cross-sectional units.
How do I decide between fixed-effects and random-effects panel regression?
Run a Hausman test: a significant result favours fixed effects (firm-specific effects are correlated with the predictors), a non-significant result allows random effects. State which you ran and what it indicated in your methodology chapter.
What is the minimum event window for an event study?
There is no fixed minimum; a common choice is a short window of a few days around the event (for example, -1 to +1 trading days) to capture the immediate reaction while minimising contamination from unrelated news, with the exact window justified against your specific announcement type.
Can I use a t-test on financial ratio data?
Yes, provided the ratio is roughly normally distributed within each group; financial ratios are often skewed, particularly with small samples, so check normality first and use the Mann-Whitney U test where it fails.
What if my regression has multicollinearity among the financial ratios I am using as predictors?
Check the variance inflation factor for each predictor; a commonly cited rule of thumb flags VIF above 10 as a concern, though some fields apply a stricter cutoff. Consider dropping or combining highly correlated ratios, since several common financial ratios (like current ratio and quick ratio) are naturally correlated with each other.
Is Granger causality the same as economic causality?
No. Granger causality tests whether past values of one series statistically improve the prediction of another; it does not establish a true causal mechanism, and stating this distinction explicitly protects your discussion chapter from overclaiming.
Do I need to test for stationarity before every time-series analysis?
Yes, for any regression or correlation involving time-series data. Regressing one non-stationary series on another can produce a statistically significant but economically meaningless result, a well-documented problem called spurious regression.
Which software runs these tests?
SPSS and JASP handle correlation, regression, t-tests, ANOVA and chi-square through their standard menus; panel regression, event studies and time-series tests (ADF, cointegration, Granger causality) are more commonly run in R, EViews or Stata, which most Indian finance departments have access to through the library or computer lab.
How many years of panel data do I need for a fixed-effects regression?
There is no universal minimum, but too few time periods relative to the number of firms weakens the within-firm variation fixed-effects estimation relies on. Three to five years across a reasonably sized set of firms is common in published Indian accounting and finance studies, though your specific design should be checked against the power and sample-size reasoning in our guide to calculating sample size for a thesis.
Match the test to the claim, not the claim to the test
Naming the right test is a decision you make from your hypothesis, not from which software you are most comfortable in. Tesify helps you state each objective, its hypothesis and its matching analysis tool consistently across your methodology and results chapters, so the test you name in Chapter 3 is exactly the test your Chapter 4 tables report.