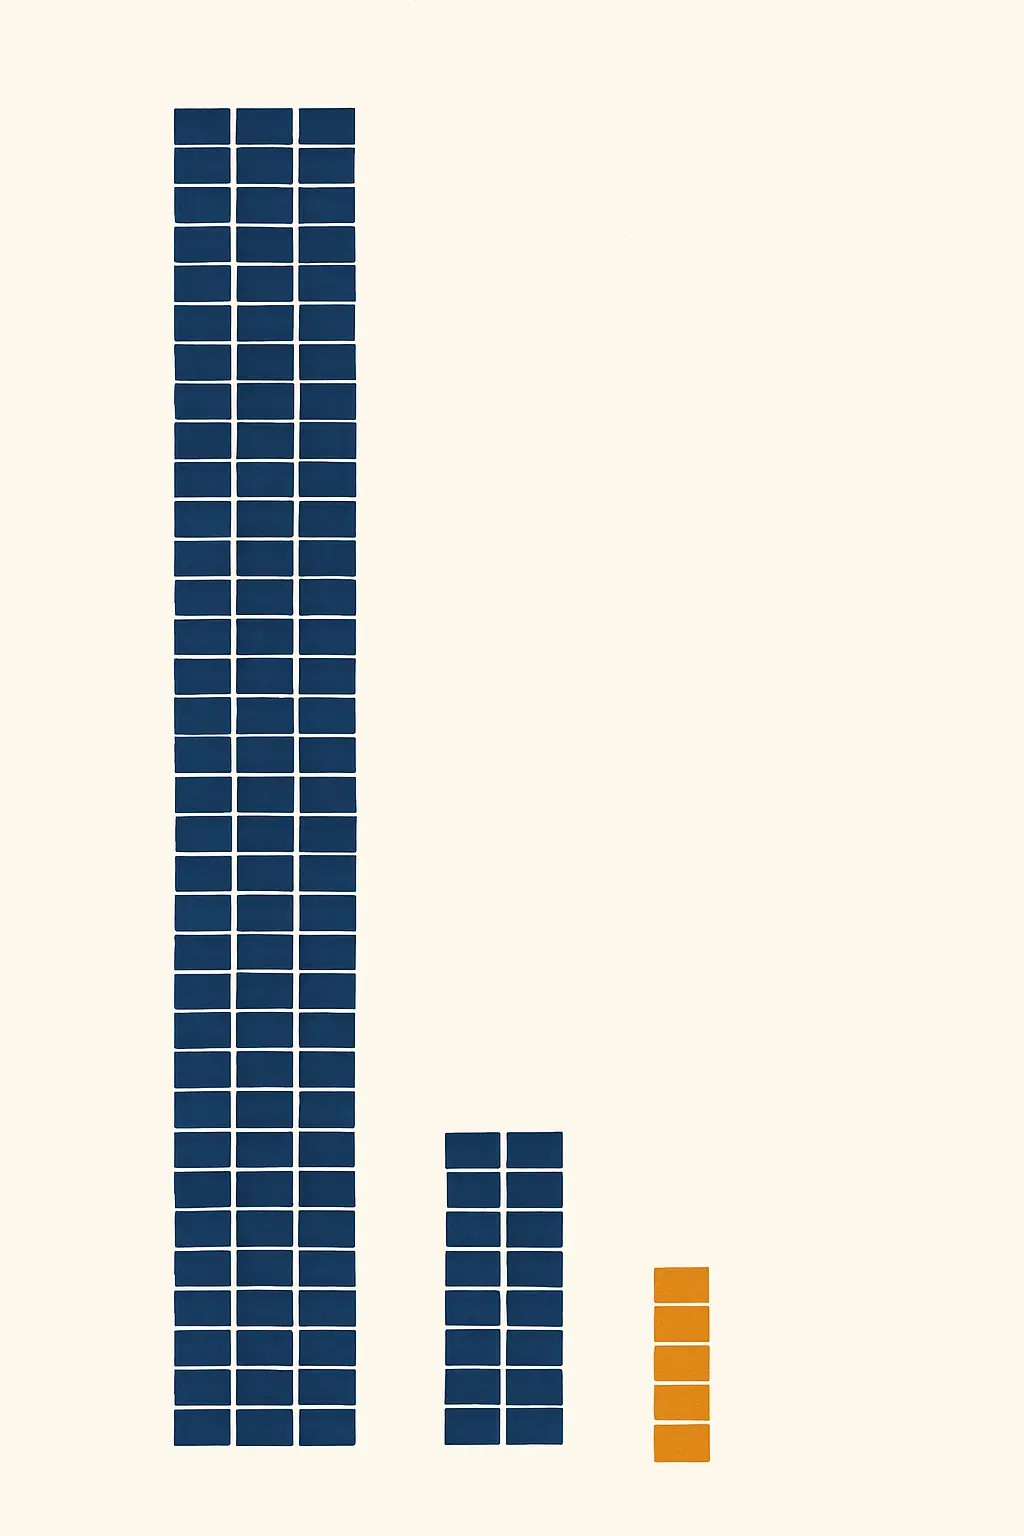
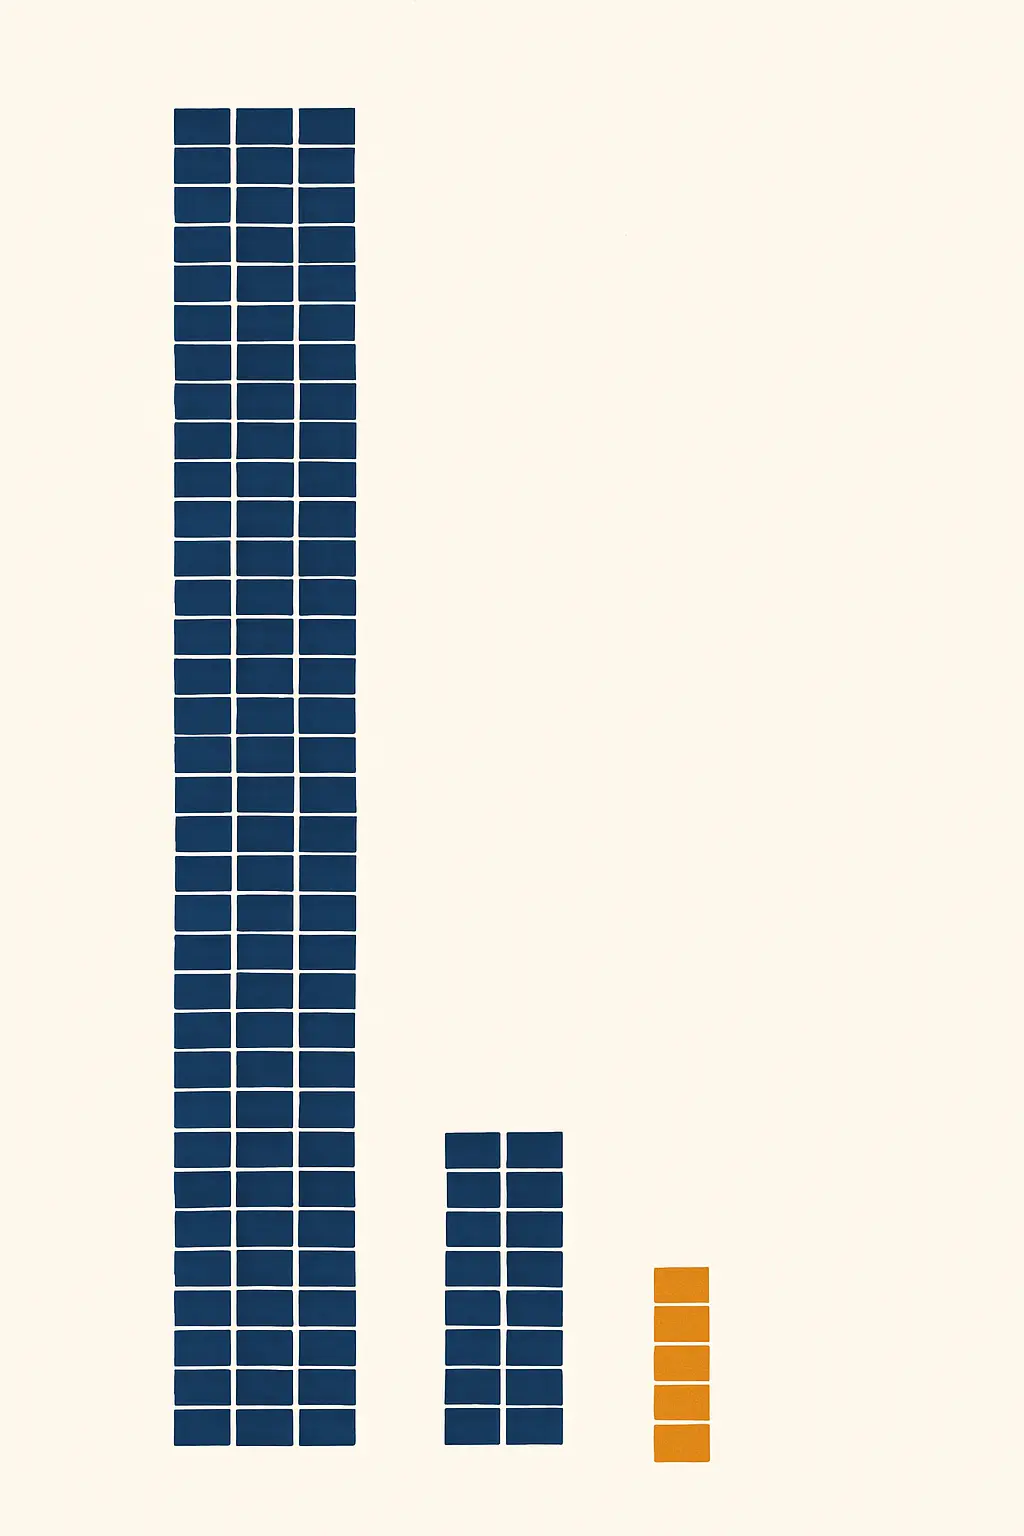
No Indian authority publishes a national count of academic plagiarism cases. The nearest citable measure is the retraction record, and on that measure India ranks third in the world: 6,340 records with at least one India-affiliated author in the Retraction Watch database, behind China (37,874) and the United States (7,428). About a quarter of those records carry a plagiarism or duplication tag. All figures below were recomputed from the full dataset on 18 August 2026.
Why there is no case count, and what we used instead
The UGC’s Promotion of Academic Integrity and Prevention of Plagiarism in Higher Educational Institutions Regulations, 2018 set out the levels of similarity and the penalties attached to each, and require every institution to constitute academic misconduct panels. What they do not do is require those panels to report their caseload to a central register, and no such register is published. AISHE counts enrolment, teachers and institutions; it does not count disciplinary proceedings. So the honest answer to “how many plagiarism cases are there in Indian universities?” is that nobody knows, including the regulator.
What can be counted is the published record: papers that were retracted, corrected or flagged with an expression of concern, and the stated reason. Crossref Labs distributes the entire Retraction Watch database as a single open file with no key and no paywall — 71,871 rows at the time of retrieval. That makes every figure in this article reproducible by anyone with the same file.
The headline numbers
| Measure | Value | Source and date |
|---|---|---|
| Records with at least one India-affiliated author | 6,340 | Retraction Watch database via Crossref Labs, retrieved 18 Aug 2026 |
| India’s global rank | 3rd (China 37,874 · United States 7,428 · India 6,340 · Russia 3,161 · Saudi Arabia 2,527) | Same file, recomputed |
| Of which the notice is a full retraction | 6,001 | Same |
| Expressions of concern | 208 | Same |
| Corrections | 126 | Same |
| Reinstatements | 5 | Same |
| Records with only India-affiliated authors | 4,158 | Same |
| Records with at least one non-India affiliation as well | 2,182 | Same |
The caveat that changes the number: the country field is an affiliation field
The database records the countries of the authors’ institutional affiliations, not where the research was conducted and not where the university sits. A paper by a scholar employed at an Indian university, reporting fieldwork elsewhere, counts as India. A paper by an Indian author working abroad does not. And 2,182 of the 6,340 records — more than a third — carry at least one non-Indian affiliation as well, so they are simultaneously counted against another country.
This means “6,340 Indian papers were retracted” is not a sentence you should write. “6,340 records list at least one India-affiliated author” is. The same trap applies to every country-filtered bibliographic query and it is the most common way a rigorous-looking statistics paragraph goes wrong — the same class of error we flag in what is and is not verifiable in Indian higher-education data.
The series by year, and why the spikes are not what they look like
| Retraction notice year | India-affiliated records | World total | India share |
|---|---|---|---|
| 2019 | 191 | — | — |
| 2020 | 223 | 3,649 | 6,1% |
| 2021 | 317 | 5,135 | 6,2% |
| 2022 | 1,216 | 6,451 | 18,8% |
| 2023 | 883 | 13,554 | 6,5% |
| 2024 | 1,018 | 6,615 | 15,4% |
| 2025 | 1,082 | 5,959 | 18,2% |
| 2026 (to 18 Aug) | 217 | — | part year |
Do not read the share column as a trend. The 2023 world total is inflated by a single publisher’s mass clean-up of compromised special issues, which is why India’s share appears to collapse and then recover. The denominator moved, not the numerator.
The Indian series has the same problem in the numerator. Of the 1,216 records dated 2022, 725 — sixty per cent — come from just three venues: the Journal of Ambient Intelligence and Humanized Computing (355), Journal of Physics: Conference Series (244) and IOP Conference Series: Materials Science and Engineering (126). The 2024 total is similarly concentrated (Soft Computing 266, Journal of Intelligent & Fuzzy Systems 155) and so is 2025 (Journal of Intelligent & Fuzzy Systems 274, Neurosurgical Review 129).
What the year-on-year rise therefore measures, to a large extent, is publishers auditing their own back catalogues — particularly conference proceedings and guest-edited special issues. That is a real integrity signal, but it is a signal about the venues, not a measurement of how many Indian scholars behaved badly in a given year.
What the records are actually retracted for
Each record can carry several reason tags. Counting the number of India-affiliated records that carry each tag at least once:
| Reason tag | Records |
|---|---|
| Investigation by journal or publisher | 4,002 |
| Unreliable results and/or conclusions | 2,423 |
| Compromised peer review | 2,203 |
| Concerns or issues about referencing/attributions | 2,045 |
| Investigation by a third party | 1,796 |
| Computer-aided or computer-generated content | 1,273 |
| Rogue editor | 1,035 |
| Concerns or issues about data | 927 |
| Paper mill | 872 |
| Duplication of or in an image | 506 |
| Plagiarism of or in an article | 500 |
| Euphemisms for plagiarism | 423 |
Plagiarism is a minority of the picture. Taking every plagiarism tag together — of an article, of text, of data, of an image, plus the “euphemisms for plagiarism” category the database uses when a notice describes it without naming it — 802 records carry at least one. Taking every duplication tag together gives 901. Records carrying either come to 1,651, roughly 26% of the Indian total.
The three larger categories are all systemic rather than individual: compromised peer review (2,203), rogue editors (1,035) and paper mills (872) describe the manipulation of a publication venue, not a scholar copying a paragraph. For a research scholar, the practical implication is uncomfortable but useful: your risk of ending up in this dataset comes less from your own writing than from where you choose to publish.
The AI-content tag is now the fastest-moving category
The database’s “computer-aided content or computer-generated content” tag went from 8 India-affiliated records in 2021 to 365 in 2022, 289 in 2023, 155 in 2024 and 434 in 2025 — its highest year so far. This is a tag applied by journals in their notices, so it counts what publishers detected and chose to name, not the true rate of use. Read alongside what the integrity rules actually require of you, it is the clearest available evidence that publishers are now retracting explicitly on this ground.
How long the record stays uncorrected
Across all 6,340 India-affiliated records, the median gap between the original paper’s date and the retraction notice is 617 days — about one year and eight months. The middle half of cases falls between 335 and 1,064 days, and only 29,8% are retracted within a year of publication.
That lag is the single most important number in this article for a scholar writing a literature review. A paper published two years ago that will eventually be retracted currently looks, in every database, exactly like a sound one. Checking your reference list against the retraction record is therefore a real step, not a formality — and the file is free.
Where the retractions sit, by discipline and article type
| Subject tag | Records |
|---|---|
| Computer science | 1,955 |
| Technology | 1,614 |
| Data science | 1,069 |
| Biochemistry | 737 |
| Materials science | 702 |
| Cellular biology | 515 |
| Nanotechnology | 432 |
| Electrical engineering | 422 |
By article type, 4,762 records are research articles, 678 are conference abstracts or papers, 333 are review articles and 118 are clinical studies. The conference-paper share matters: proceedings series were the venue for the largest bulk actions, and conference publication is heavily used in Indian engineering departments.
What we deliberately are not reporting
- No institutional ranking. The database’s institution field is free text, not a normalised identifier. The same university appears under many different strings — department names, campus names, postal fragments — so any “top ten Indian institutions by retractions” built from it would be an artefact of how affiliations happened to be typed. We can see the fragmentation clearly in the file and therefore decline to publish a league table.
- No retraction rate per published paper. Dividing retractions by output requires the two to be counted on the same basis, and they are not: retractions are dated by notice year, publications by publication year, and the two databases index different venues. See how many papers India publishes for why the denominator is itself contested.
- No claim about misconduct prevalence. A retraction is a publisher’s action. Undetected problems are not in the file by definition, and some retractions are honest error.

What a research scholar should do with this
- Screen your reference list before submission. Retraction status is surfaced by Crossref and by the major reference managers; the full database is also open, so a bulk check against your DOI list is a single afternoon’s work.
- Weigh the venue, not just the indexing. The concentration of bulk retractions in a handful of proceedings series and special issues is the strongest argument available for the checks in our journal verification guide.
- Treat a citation to a retracted paper as a defect in your literature review, and say so if you find one late — a footnote acknowledging the retraction is far better than an examiner finding it. The mechanics are in how to write the literature review.
- Keep your own similarity work separate from all of this. Institutional screening is about your text; the retraction record is about the literature. Both matter, and a high similarity report is a different problem with a different fix.
Frequently asked questions
How many plagiarism cases are there in Indian universities?
No published national figure exists. The UGC’s 2018 Regulations require institutions to constitute academic misconduct panels but do not require aggregated public reporting, and no central register is published. The nearest citable proxy is retractions.
How many Indian research papers have been retracted?
6,340 records in the Retraction Watch database list at least one India-affiliated author, of which 6,001 are full retractions, as retrieved on 18 August 2026. That places India third globally.
Is India the worst offender?
No. China accounts for 37,874 records, more than five times India’s count and over half the global file. Absolute counts also track publication volume, so a country that publishes more will appear more often.
What proportion of Indian retractions are for plagiarism?
About 13% carry a plagiarism tag (802 records) and about 14% a duplication tag (901); together, allowing for overlap, 1,651 records or roughly 26%. Compromised peer review, unreliable results and paper mills account for more.
Is the number rising?
The annual counts rise, but a large share of the rise is bulk action by publishers on specific journals and proceedings series rather than a change in author behaviour. Sixty per cent of the 2022 records came from three venues alone.
Where does this data come from?
The Retraction Watch database, distributed in full and without a key by Crossref Labs. Every figure here was recomputed locally from that file on 18 August 2026; the file held 71,871 rows.
Can I cite these numbers in my thesis?
Yes, provided you state the retrieval date, the fact that the country field is an author-affiliation field, and that a record may be counted against more than one country. Better still, download the file and recompute — the numbers move as notices are added.
Does a retraction mean the authors committed misconduct?
No. Retraction notices cover honest error, publisher error and duplicate publication as well as misconduct, and the file records five reinstatements. Read the reason field before characterising any individual case.
Which disciplines are most affected in India?
Computer science (1,955 records), technology (1,614) and data science (1,069) lead by a wide margin, followed by biochemistry (737) and materials science (702).
How quickly are papers retracted?
The median gap between publication and retraction for India-affiliated records is 617 days. Fewer than three in ten are retracted within a year, so recent literature carries an unmeasured amount of future retraction.
Keeping your own record clean
Nothing in this dataset is about honest scholars writing carefully. But two of its findings are directly actionable while you are still writing: check the venue before you submit a paper, and check your citations before you submit a thesis.
Tesify keeps your sources, citations and chapters in one project, so a reference you need to remove or annotate can be traced everywhere it appears rather than hunted through six files. Start with the free tier.